Contributors

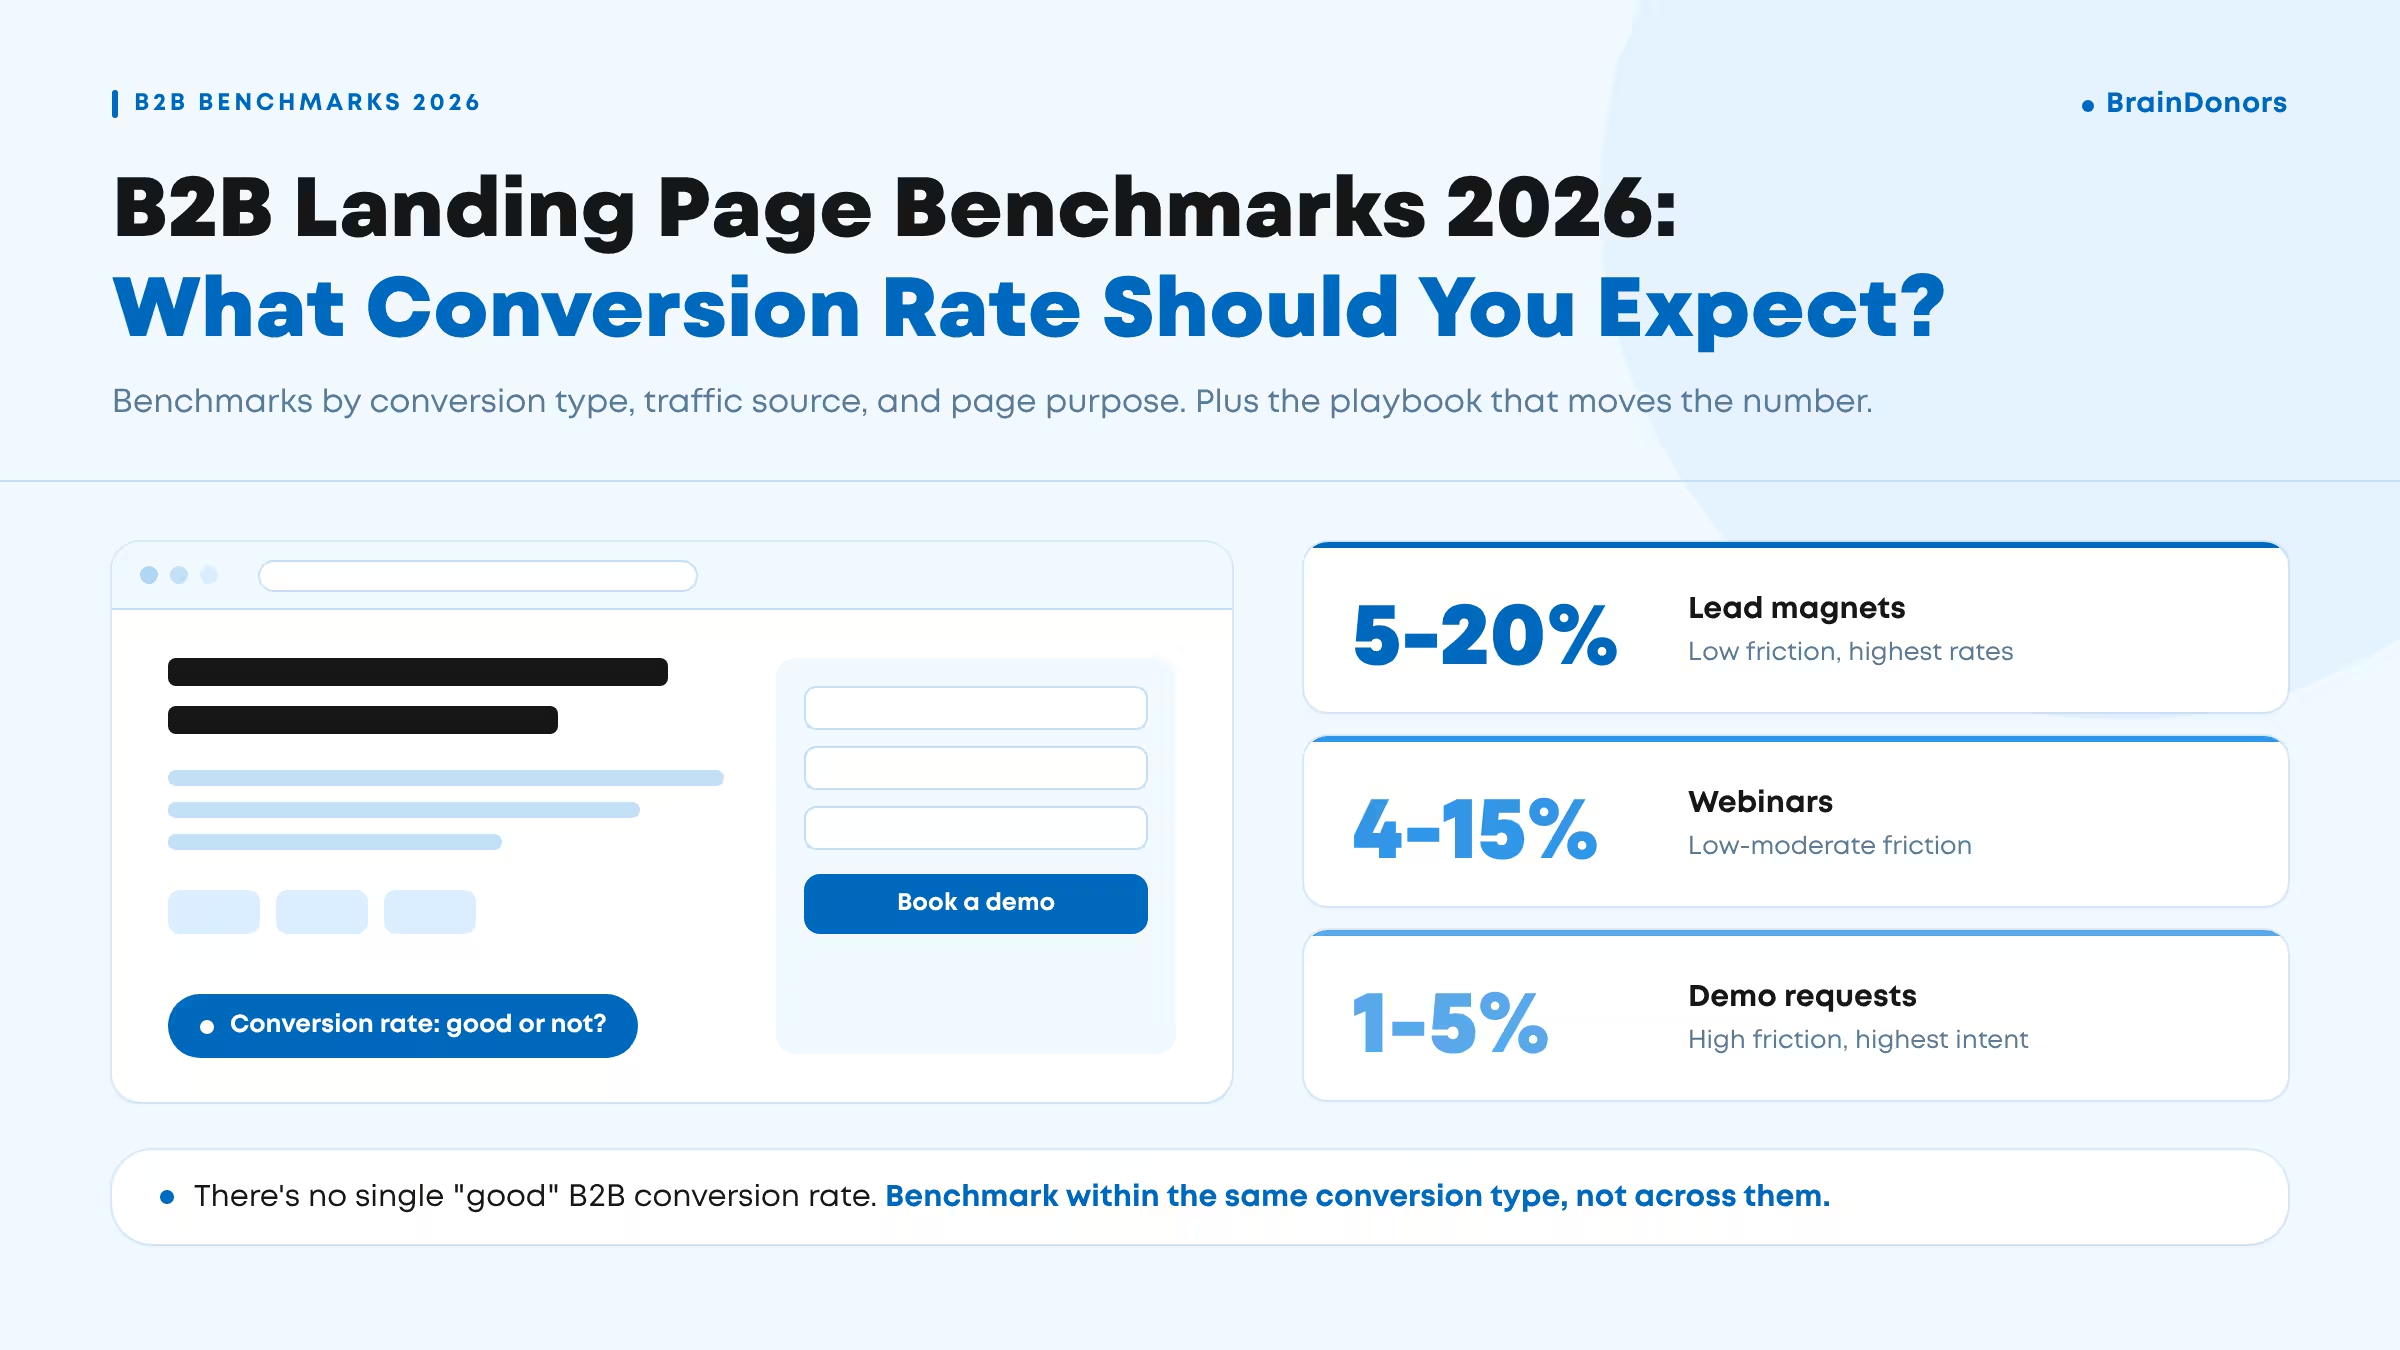

Here's what B2B landing pages typically hit in 2026, by conversion type, traffic source, and the metrics around them.
Of all of these, conversion rate is the one we watch hardest. It's where traffic either turns into pipeline or quietly leaves.
But it's also the easiest number to misread. Here's how to read it properly.

The average landing page conversion rate across all industries sits around 6.6%. But that number mixes email opt-in pages with demo request pages and free trial signups into one figure. Most published B2B conversion rate benchmarks blend everything together into one average.
The reason: different conversion actions require fundamentally different levels of commitment from the visitor.
Downloading a PDF costs nothing but an email address. Booking a 45-minute enterprise demo means committing real time and signaling buying intent. The friction gap between these two is enormous, and so is the conversion rate gap
Here are the benchmark ranges by conversion type that actually mean something:
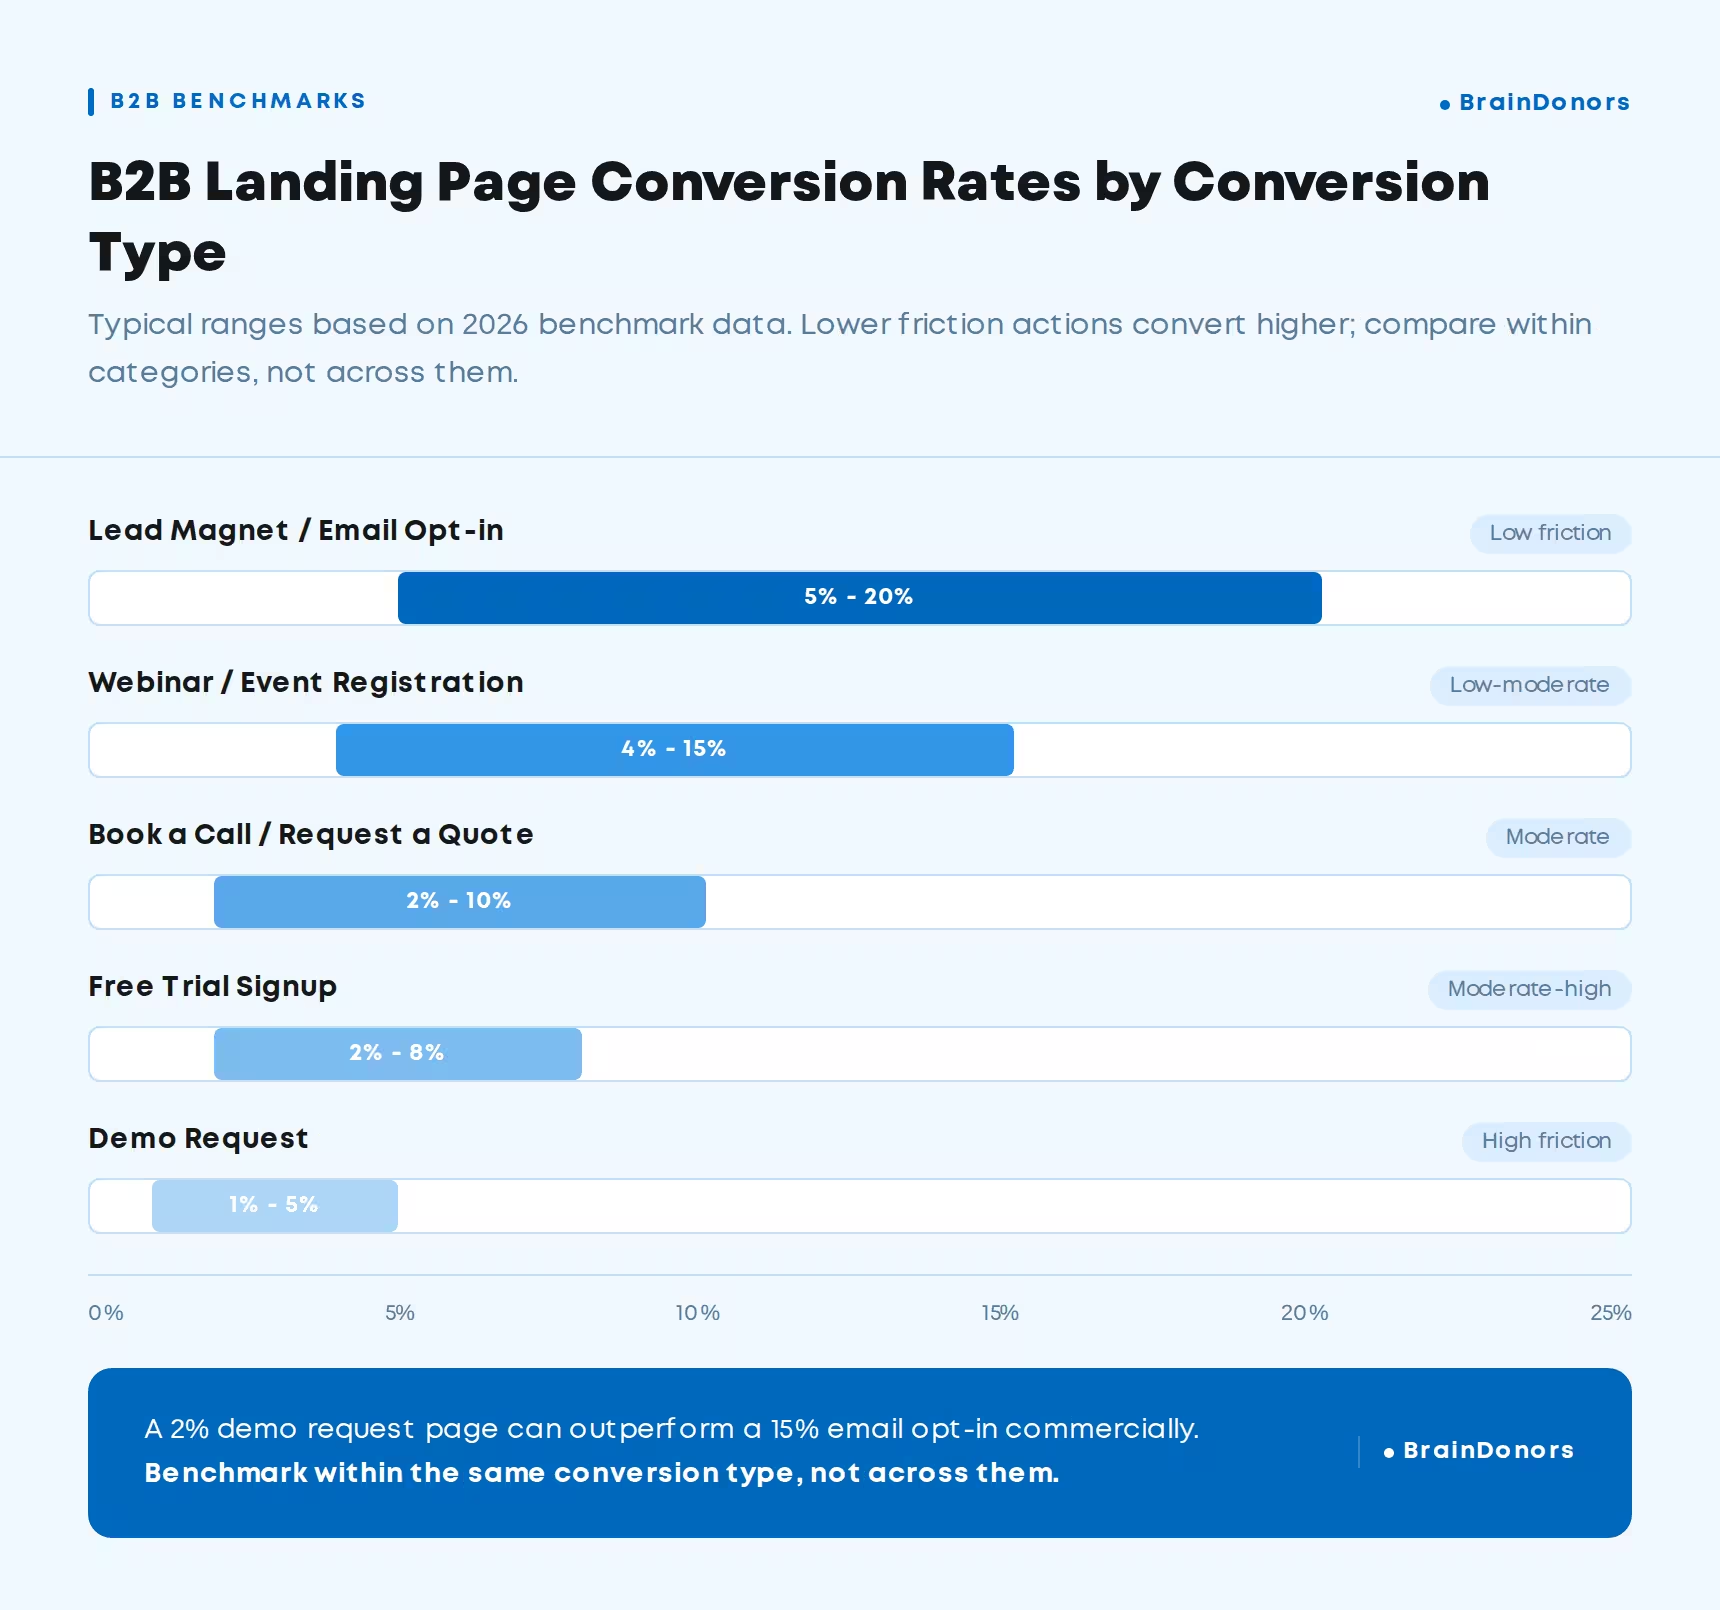
These ranges come from a 2026 benchmark analysis across thousands of landing pages. B2B SaaS conversion benchmarks tend to cluster at the lower end (longer cycles, higher friction), while financial services pages often convert higher due to stronger purchase urgency. However, such stats are rarely set in stone.
The friction-commitment relationship is the single most useful context for reading any benchmark. Your options are:
So when a SaaS company sees their demo request page at 2.5% and panics because "the industry average is 6.6%," they're comparing their highest-friction page against a blended average that includes everyone's lowest-friction pages.
You can see the issue.
Same landing page. Same offer. Same form. One traffic source converts at 3%, another at 18%.
A large part of the difference can come from the audience and intent behind the traffic.
Traffic quality - meaning how closely the visitor's intent matches your offer - shapes conversion rates as much as anything on the page itself.
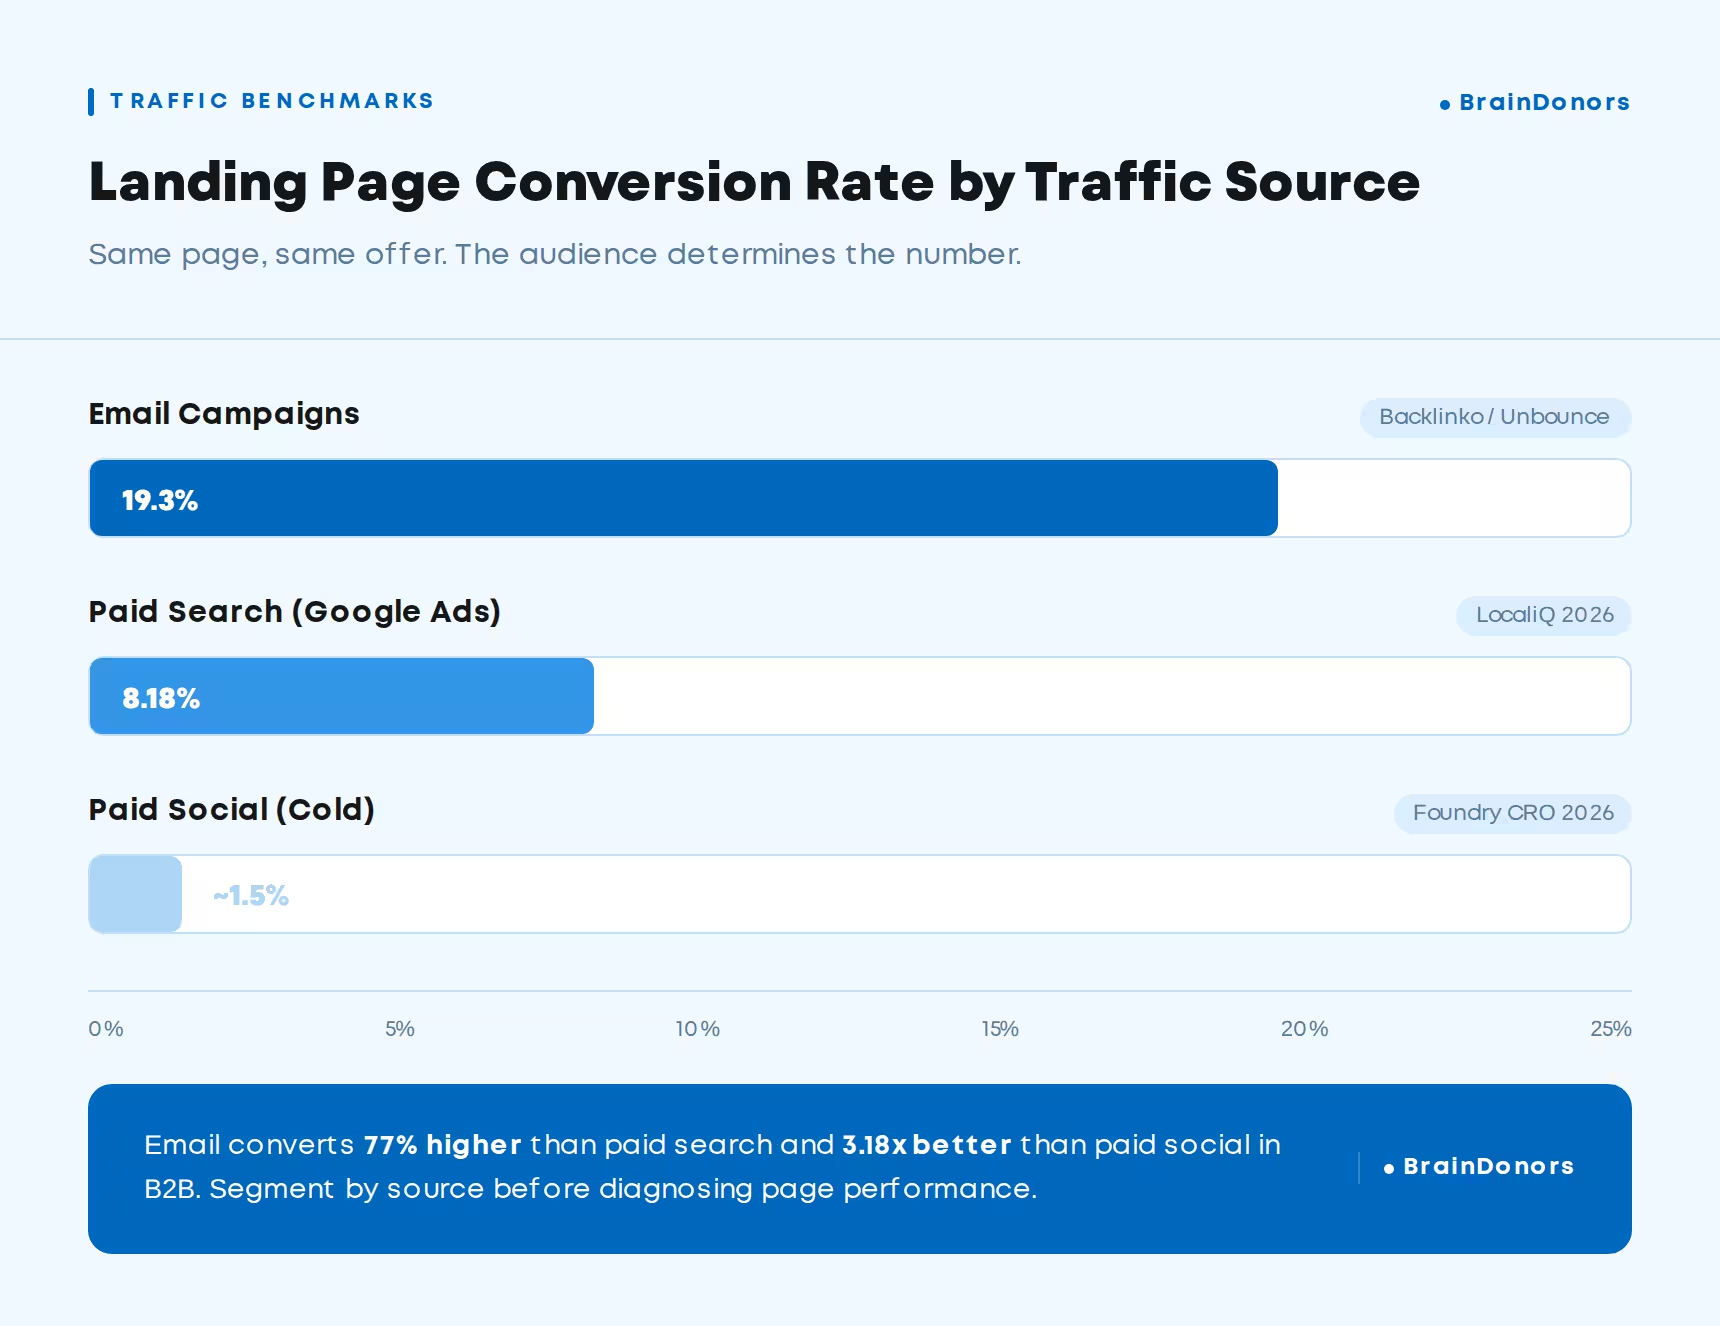
Email converts 77% higher than paid search on landing pages. In B2B commercial services specifically, email converts 3.18x better than paid social. The gap is enormous, and it's almost entirely about audience warmth and intent.
This is why segmenting by traffic source isn't optional. A page at 4% from cold LinkedIn might actually be outperforming one at 8% from warm email, once you account for where the visitor came from.
Instead of obsessing over whether you're above or below a benchmark, use the ranges as diagnostic context:
A page at 20% on low volume from a hyper-targeted audience won't maintain that rate when you scale traffic. And if conversion is high but lead quality is poor, you're optimizing for the wrong metric.
Your own historical baseline is the number you actually optimize against. External benchmarks are just context.
You’d think design.
And you’d be right, just not in the way you expect. Design is not decoration. A landing page converts when it makes the decision easier, not when it looks impressive in a portfolio.
What matters is visual hierarchy that draws attention to the right elements in the right order, and a call-to-action that makes the next step obvious without being aggressive.
Pages with a single CTA convert at around 13.5% on average, while pages with five or more drop to roughly 10.5%. Every additional link is another decision the visitor has to make. Landing page CRO starts with removing the decisions that don't serve the conversion goal.
Here’s the thing:
A polished page can still have terrible UX.
Your conversion infrastructure needs:
88% of online visitors are less likely to return after a poor experience. Bad UX doesn't just cost one conversion - it poisons future visits.
Around 83% of landing page traffic comes from mobile devices. 86% of top-performing local landing pages are mobile-responsive.
If your page looks like a shrunken desktop layout on a phone, you're losing the majority of visitors before they read the headline.
Mobile-first means:
Trust reduces perceived risk. In B2B, where decisions involve budgets and professional reputation, risk perception is the invisible wall between your visitor and your conversion.
How do you achieve that?
With evidence.
We mean:
In B2B, where the buying committee includes multiple stakeholders evaluating risk independently, proof needs to appear at the point of decision, not buried three scrolls below it.
The landing page stats prove it too: 37% of top-performing pages feature testimonials.
Google Ads clicks go to a page built for that keyword and intent. LinkedIn campaign traffic goes to a page built for that audience and offer. Gated content promotions go to a download page. Product-led growth (PLG) signup flows go to a dedicated free trial page.
This tight alignment is what separates campaign pages from general website pages. And 44% of B2B companies still miss it entirely - directing paid traffic to a generic homepage.
Homepages try to serve everyone. Landing pages serve visitors that have one query and, ideally, one next step.
Campaign pages are also easier to attribute,test, iterate, and kill when they stop working, because every variable stays controlled.
Evergreen landing pages are the service pages, solution pages, use-case pages, and industry pages that live permanently on your website and attract ongoing organic, direct, and referral traffic.
These pages serve broader intent. Someone arriving from an organic search for "B2B demand generation agency" might be casually researching or ready to reach out tomorrow. The page needs to handle both mindsets.
Which is exactly why your B2B SEO strategy and your landing page strategy need to work together. SEO brings the traffic. The page converts it.
Campaign pages benefit from tighter audience-message-traffic alignment, which often produces higher rates in controlled settings. Evergreen pages serve more varied intent, which can dilute conversion even when the page is well-built.
But "campaign pages always convert better" as a universal rule?
There’s not enough clean data to say that responsibly.
The honest answer: benchmark each page according to its purpose and its traffic. A campaign demo page at 3% and an evergreen solution page at 1.5% might both be performing well in their respective contexts.
Message match is the consistency between what the ad promised and what the landing page delivers.
The visitor clicks a Google Ad saying "Get Your Free B2B Marketing Audit." Lands on a generic homepage with six navigation links and a paragraph about company history. The gap between expectation and reality creates immediate friction.
And 44% of B2B companies are guilty of this.
The ad promise, headline, offer, and CTA should tell one coherent story. The visitor shouldn't have to re-orient after clicking through.
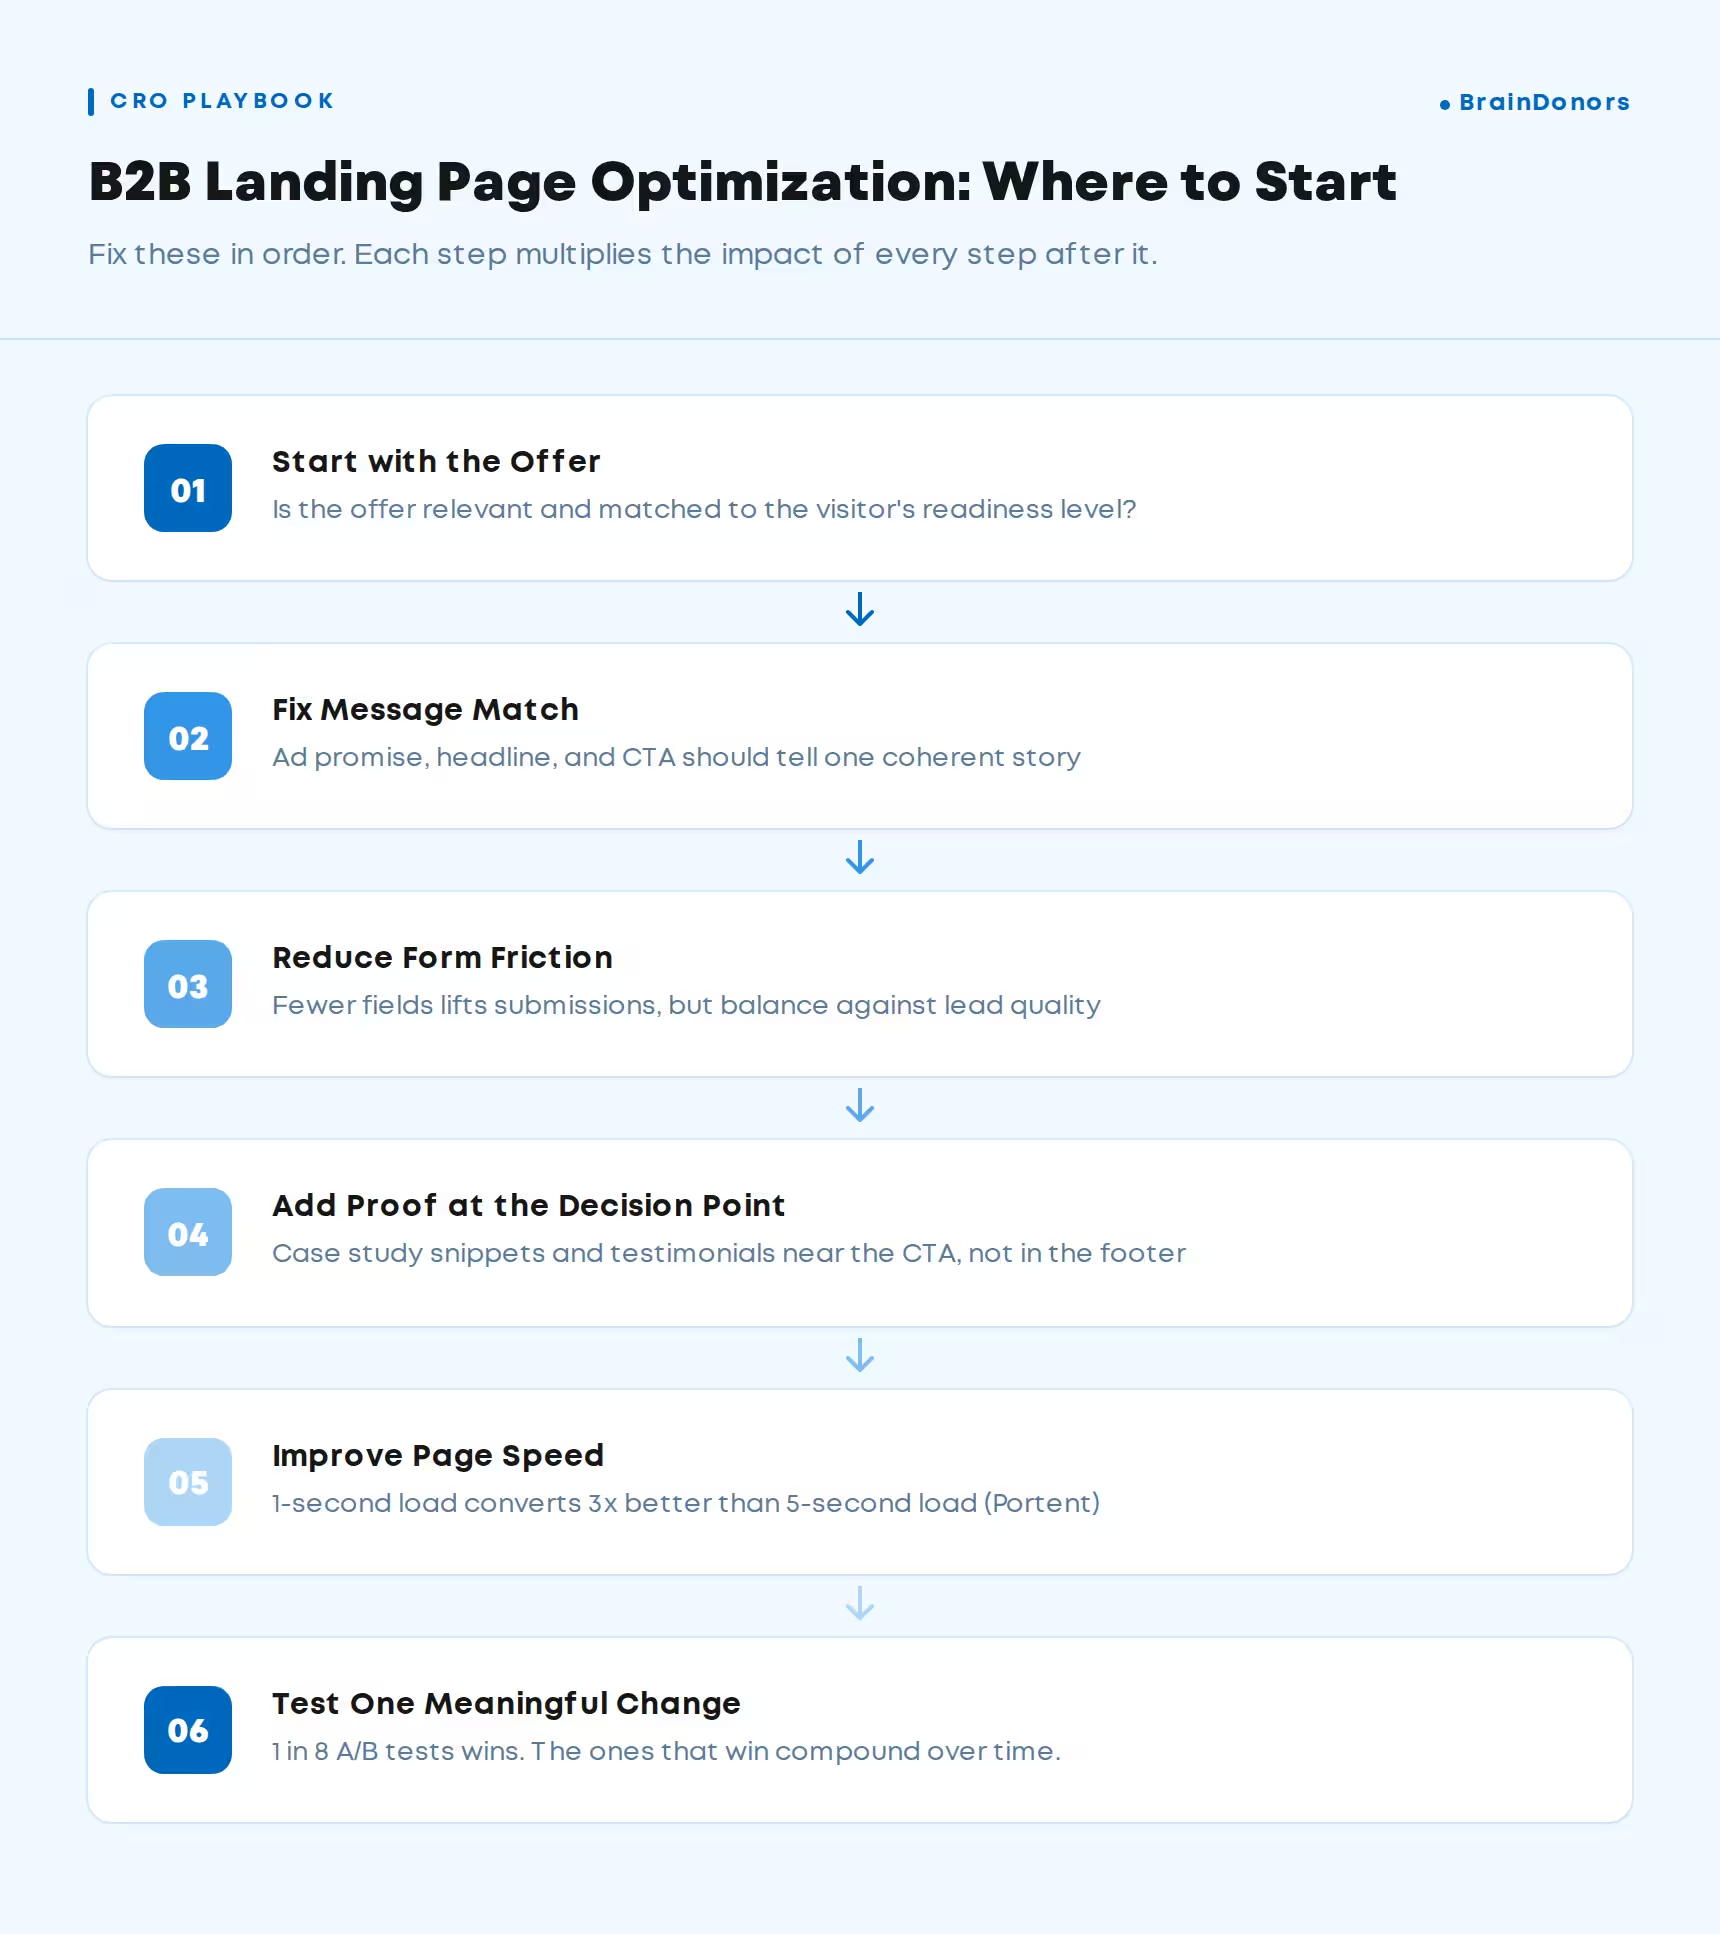
Before testing anything visual, ask yourself:
Is the offer itself relevant to the visitor, and matched to their readiness level?
A visitor in early research mode doesn't want a 60-minute consultation. They want a framework or a benchmark report. A visitor who's been evaluating vendors for three weeks wants to talk to a person.
Matching offer to intent is the highest-leverage landing page conversion optimization available. It's also where most B2B demand generation strategies succeed or fail.
Visitor came from a Google Ads campaign targeting "B2B SaaS marketing agency." Headline says "Welcome to Our Digital Solutions."
Alignment lost. In two seconds.
The headline should confirm the visitor is in the right place. Immediately. This matters especially for B2B Google Ads campaigns, where message match between keyword and landing page headline directly affects both Quality Score and conversion rate.
For context, Google Ads search CTR sits around 6.8% in 2026, and LinkedIn sponsored content averages 0.44-0.65%. Those clicks aren't cheap.
Fewer fields generally means more submissions. One study found that reducing a form from 11 fields to 4 produced a 120% increase in conversions. Actually, 30.7% of marketers believe four questions are the ideal number for landing page forms.
But.
A higher CVR is not automatically a better business result.
Fewer fields can mean more submissions and poorer qualification. In B2B, where lead quality directly affects pipeline and sales team efficiency, this tradeoff matters enormously.
If reducing your form from six fields to three doubles submissions but halves the percentage of marketing qualified leads (MQLs) that become sales qualified leads (SQLs), you haven't improved anything. You've moved the bottleneck from the landing page to the sales team - and inflated your customer acquisition cost (CAC) in the process.
Conversion rate is a metric. Business outcome is the goal. Different things.
Place proof elements where the visitor is making their decision - typically near the CTA.
A customer testimonial with a specific outcome ("12x growth in impressions within four months") placed above the demo request button is worth more than a logo wall buried in the footer.
A landing page loading in 1 second converts up to 3x better than one taking 5 seconds, and up to 5x better than one at 10 seconds .
Every additional second costs you visitors who never even see your offer.
Speed is part of UX. Page load speed signals what the entire experience ahead will feel like, and visitors make that judgment before reading a word.
VWO's 2026 Experimentation Benchmark Report - 193,000 experiments across 38,000 websites - confirms what experienced marketers already suspect: only about 1 in 8 A/B testing experiments produces a measurable winner. CTA copy is the most-tested element, with roughly a 10% win rate.
Most of your test ideas won't win. The ones that do compound over time.
The process:
Things that are worth testing include:
A high-CVR page generating poor-fit leads is commercially weaker than a moderate-CVR page generating qualified pipeline.
On a top-of-funnel lead magnet, submission volume matters. On a bottom-of-funnel demo request, lead-to-opportunity conversion rate matters more than raw count.
One metric shouldn't blind you to the full picture.
Form submission, content download, demo booking, free trial signup, purchase – each is a different action with a different baseline.
The formula is quite simple:
Conversions ÷ Landing page visits x 100 = Conversion rate.
Don't combine campaign pages with product pages with lead magnets with demo request pages into one blended rate. Each has its own context and benchmark range. A 3% demo page dragging down the average of a 15% lead magnet page tells you nothing about either.
Compare like with like.
For example:
Record your current state before changing anything: visitors, conversions, CVR, device split, traffic source breakdown, page purpose, CTA type, form completion rate.
Then optimize against your own baseline. Not someone else's highlight reel.
Every page should meet these standards before going live:
Before You Publish
Every page should meet these standards before going live:
1. one clear conversion goal
2. a defined audience
3. a strong value proposition
4. message match between traffic source and page
5. an obvious CTA
6. proof elements
6. mobile UX
7. a manageable form
8. fast load time (under 3 seconds)
9. tracking in place.
The job doesn’t end with completing the checklist. You’ll need to monitor CVR continuously. Segment by traffic source and device, identify friction through heatmaps and form analytics. Run tests based on hypotheses, not hunches.
Evaluate conversion quality, not just volume.
Then repeat.
There is no single "good" B2B landing page conversion rate in 2026.
The appropriate benchmark depends on the conversion goal and the offer on one side, the audience and traffic intent on the other.
A demo request page converting at 2.5% from cold paid search can be a stronger commercial performer than a lead magnet page converting at 15% from social - if the demo leads close at a higher rate and generate more revenue.
The system that produces results is Benchmark → Diagnose → Optimize → Test → Re-benchmark. Landing page conversion optimization is a cycle, not a project.
Your own data, segmented properly, is always more valuable than someone else's average. Published B2B website conversion rates and B2B lead generation conversion rates tell you where the market sits. Only your own numbers tell you where you stand.
And if your pages attract traffic but don't convert it into pipeline, the problem often isn't the landing page in isolation. It's the system around it. The traffic strategy and the content that builds credibility need to work alongside your conversion infrastructure, not independently of it.
Your landing pages are converting. The question is into what?
We build the systems that turn B2B landing page traffic into qualified, attributable pipeline, not just form submissions.
Interested?
It depends on the conversion action. Lead magnet pages typically convert at 5-20%, webinar registrations at 4-15%, quote or call booking pages at 2-10%, free trials at 2-8%, and demo requests at 1-5%. These ranges shift further by traffic source — a page at 3% from cold paid social might outperform one at 8% from warm email. Always benchmark within the same conversion type and traffic source.
It depends on the channel. The average CTR benchmark sits around 6.8%, though B2B verticals like financial services (5.4%) land below that. LinkedIn sponsored content CTR averages 0.44-0.65%, which is standard for the platform. A high CTR paired with a low conversion rate usually signals a message match problem — the ad promised something the page didn't deliver.
For a landing page, 12% is above average for most B2B conversion types — within range for a lead magnet (5-20%) and exceptional for a demo request (1-5%). The real question is what happens after the conversion. A 12% rate generating unqualified leads is commercially weaker than a 4% rate generating prospects that close. Conversion rate is only half the picture; lead quality completes it.