Contributors


Every planning season, the same question lands on the CMO's desk: how much pipeline is marketing on the hook for next year? The CEO wants a number. Sales wants a bigger one, and finance wants to know what it will cost.
Most teams answer by taking last year's figure and adding 20%. That works until the win rate drops, the sales cycle stretches, or half the pipeline turns out to be deals nobody was ever going to close.
This guide gives you a simpler and more honest way to set your 2027 number. You'll get the reverse-funnel math, a coverage ratio based on your own data, a worked example, and a simple template you can copy.
There's no universal percentage. Anyone who quotes one without asking how you sell is guessing.
Marketing's share depends on how your customers buy and how your revenue team is built. Here are the ranges we typically see across B2B SaaS accounts:
Marketing’s share should be agreed with sales leadership, and the agreement should rest on evidence. Picking a percentage first and working backward from it usually ends with a number marketing can’t hit.
Start with what other sources can realistically produce. If your SDR team created 120 opportunities last year and you aren't hiring, they won't create 300 in 2027. Whatever is left after partners, outbound and AE self-sourcing is your starting point. Check whether it’s achievable, then agree on it as the share marketing owns.

A pipeline generation plan turns a revenue target into the number of qualified opportunities each team has to create, by quarter and by source. It sits between the board's growth goal and marketing's channel budget.
A useful plan answers five questions:
1. How much new revenue do we need from new customers?
2. How many qualified opportunities does that take at our real win rate?
3. When do those opportunities need to exist, given our sales cycle?
4. Who creates them: marketing, SDRs, partners or account executives?
5. Can our budget and our sales team handle that volume?
If your current plan only answers the first question, you have a target. The other four turn it into something your team can act on.
In our practice, we often meet SaaS teams with solid demand generation spend and a messy plan. Marketing reports MQLs, sales reports opportunities, and nobody can say whether the two numbers add up to the revenue goal.
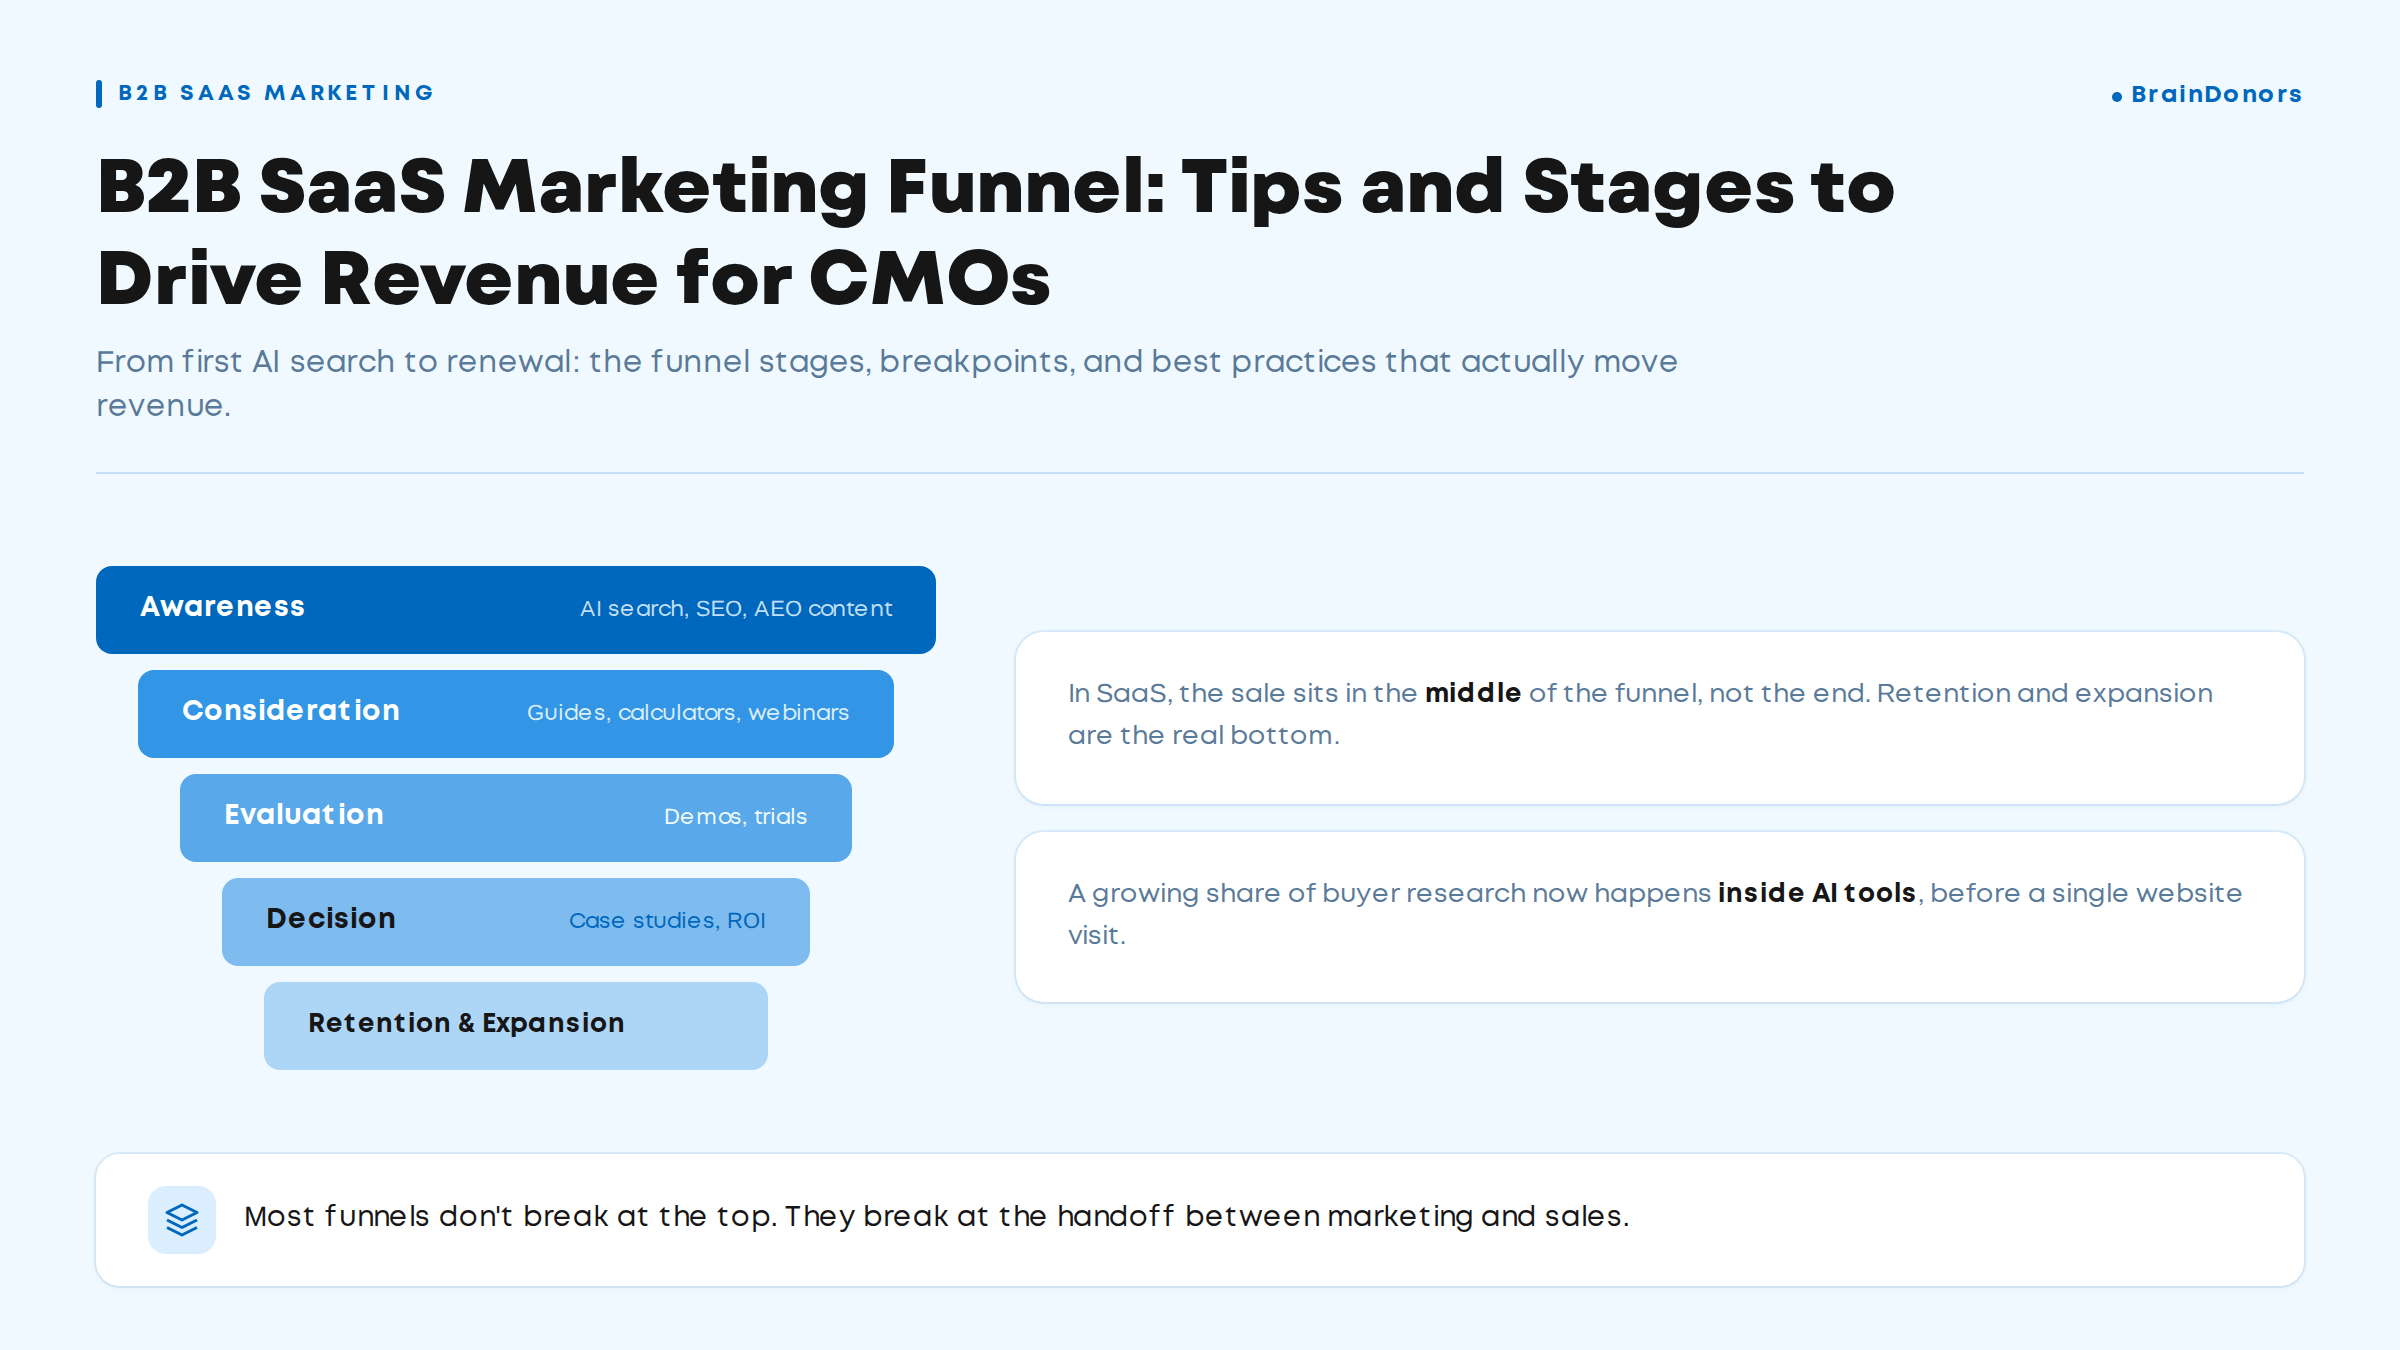
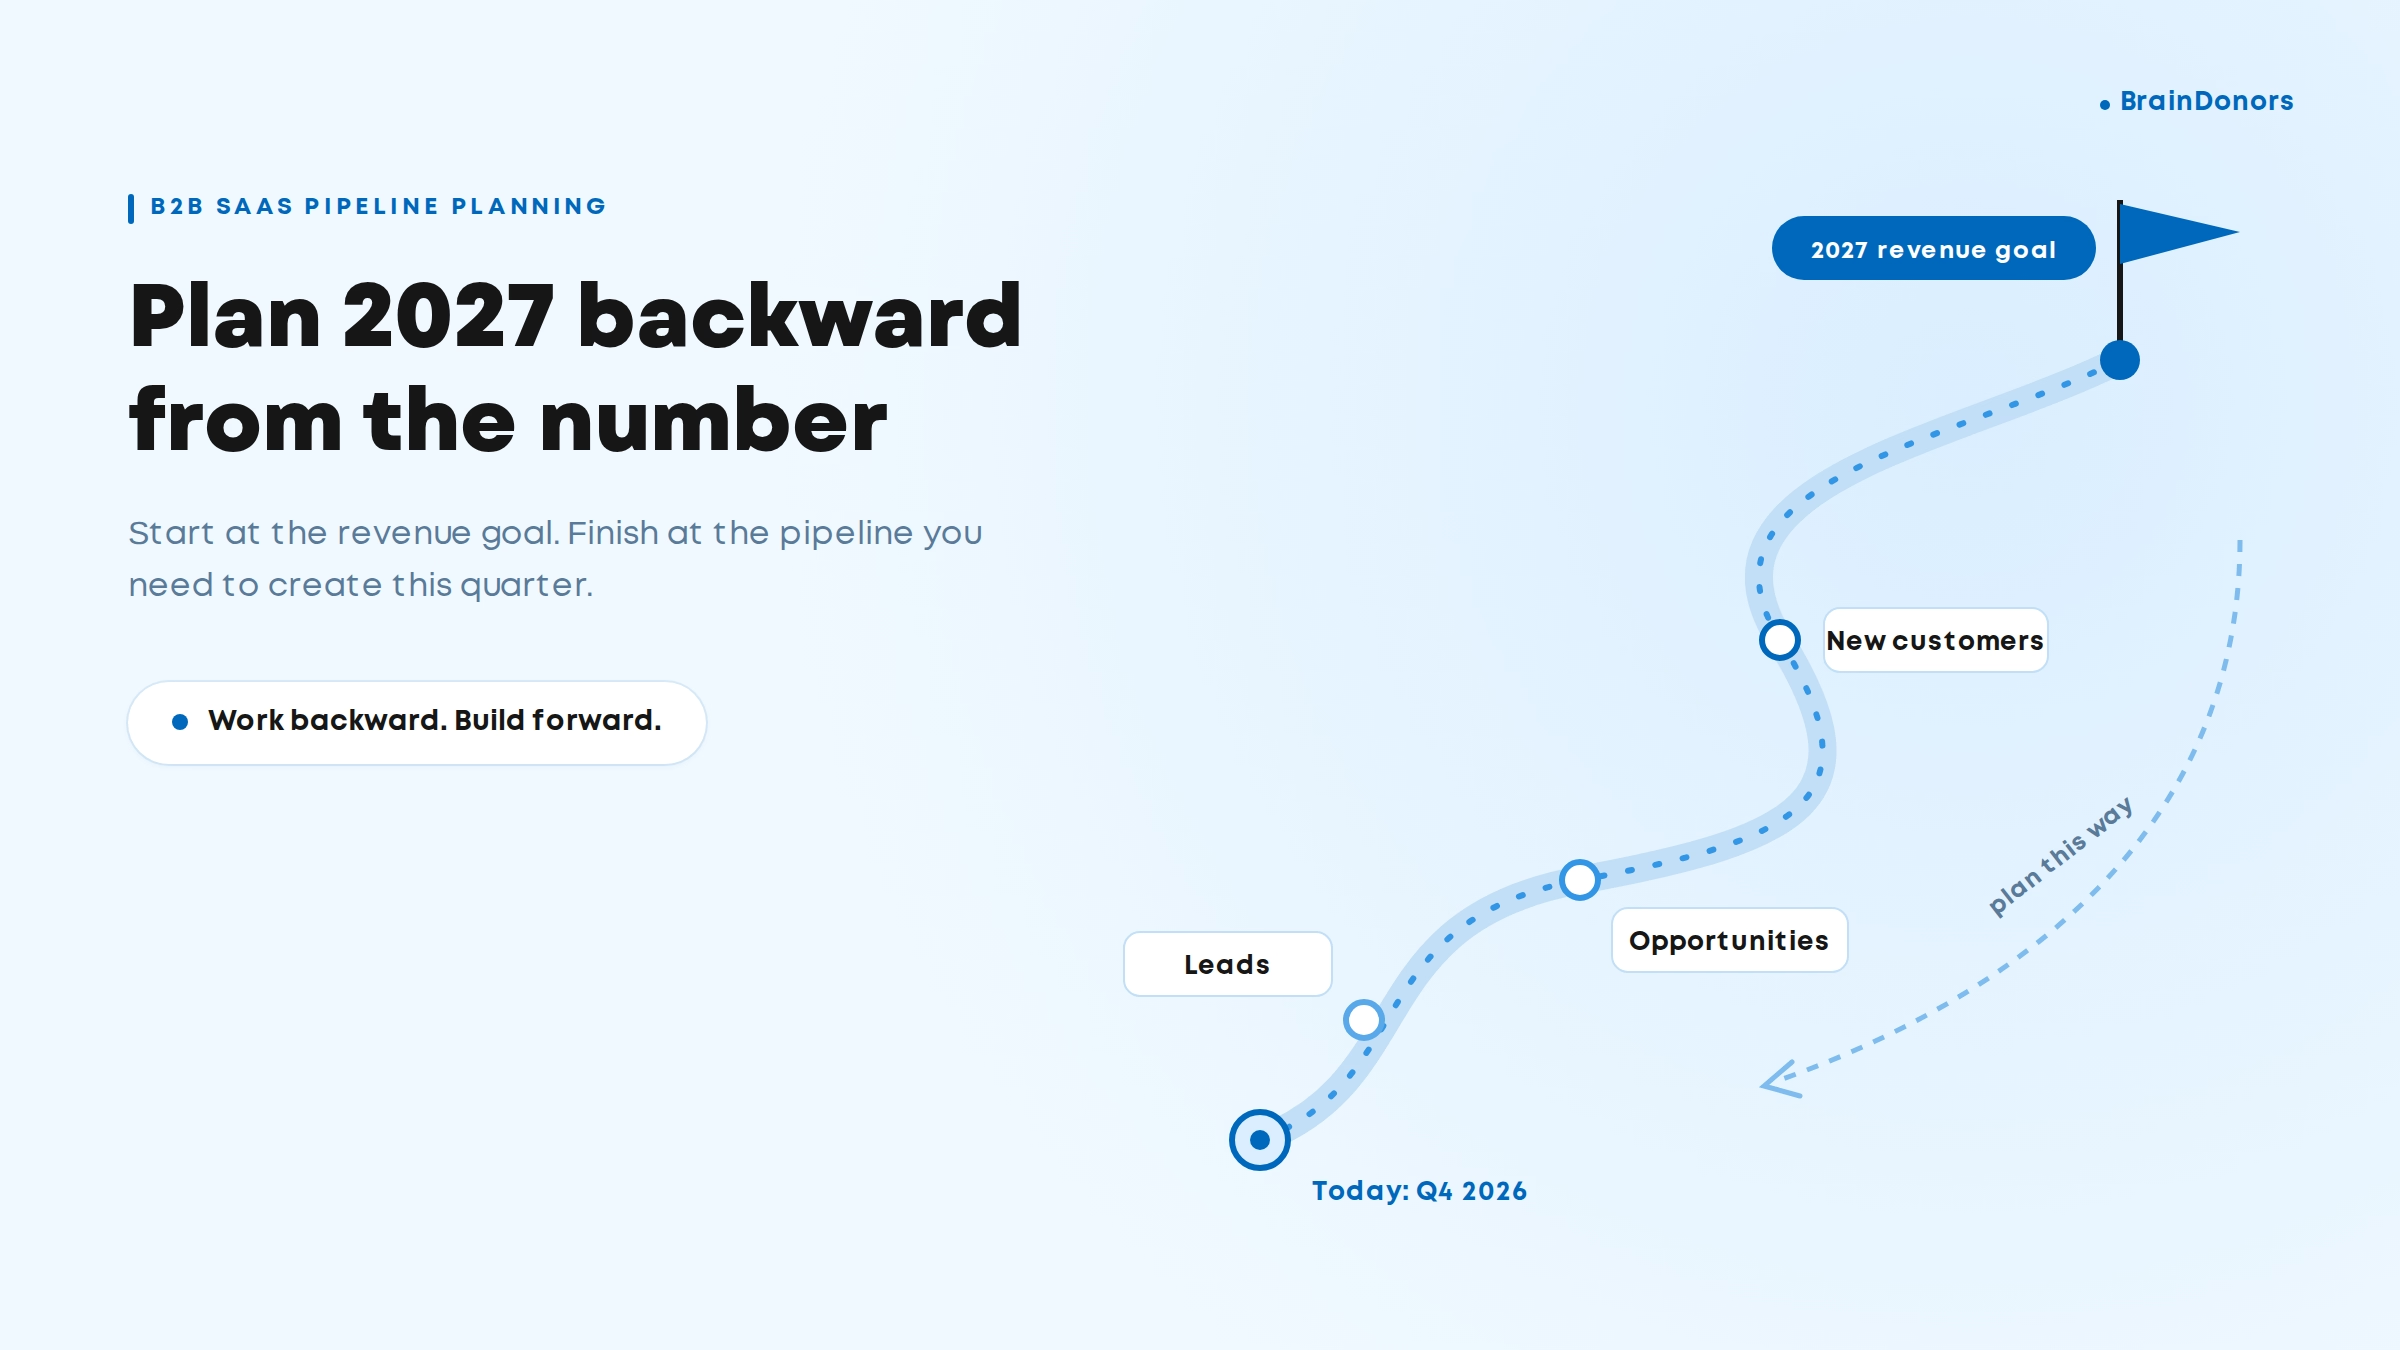
This is the reverse-funnel method. You start at the revenue goal and work down to monthly lead volume.
Use numbers from your own CRM wherever you can. Industry averages are fine for a sanity check, but they shouldn't set your targets. If you want a refresher on the stages themselves, our guide to the SaaS marketing funnel covers them in detail.
Your 2027 ARR target mixes three things: revenue you keep, revenue you grow from current customers, and revenue from new customers. Marketing mainly feeds the third.
Formula: New-logo ARR = (Target ARR - Starting ARR) + Expected churn - Expected expansion
Example: A SaaS company ending 2026 at $10M ARR wants $14M by the end of 2027. It expects $1M in churn and $1.5M in expansion from customer success. New-logo ARR needed: $4M + $1M - $1.5M = $3.5M.
Divide new-logo ARR by your average contract value (ACV) for new customers. Use the last 12 months of closed-won deals and remove outliers that skew the average.
Example: $3.5M ÷ $35,000 = 100 new customers.
Win rate here means qualified opportunities that end as closed-won. For marketing’s share, use the win rate of marketing-sourced deals, not the company-wide average. Inbound, outbound and partner deals often close at very different rates. If you sell to both SMB and enterprise, calculate it separately for each.
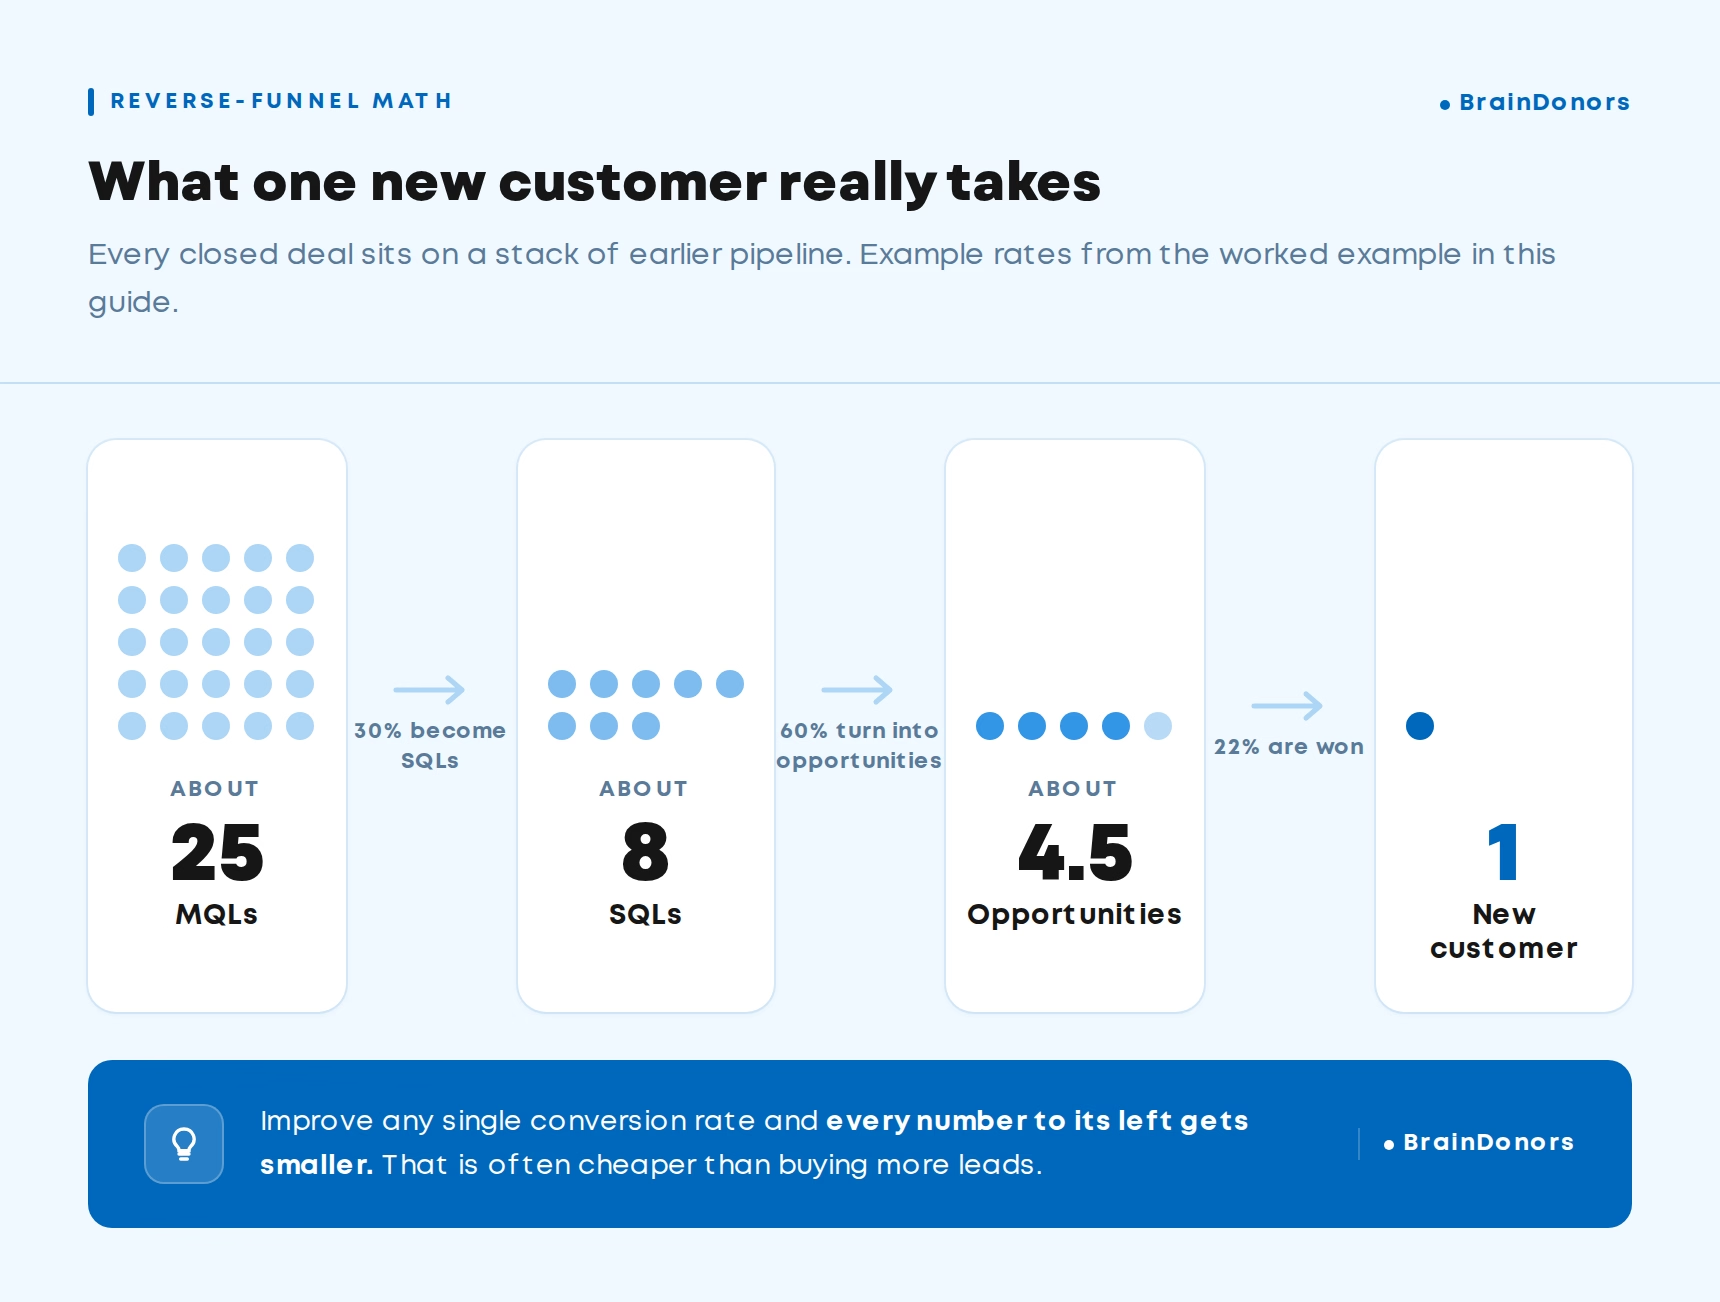
Example: 100 ÷ 22% = about 455 qualified opportunities, or roughly $15.9M in total pipeline.
Estimate what partners, SDRs and account executives will create first, based on last year's output and planned headcount. Marketing owns what's left.
Example: Partners 10%, AE self-sourced 10%, SDR outbound 25%. Marketing owns the remaining 55%: about 250 opportunities and $8.75M in pipeline.
Use your stage conversion rates to find how many sales-qualified leads (SQLs) and marketing-qualified leads (MQLs) you need.
Example: 250 opportunities ÷ 60% (SQL to opportunity) = 417 SQLs. 417 ÷ 30% (MQL to SQL) = about 1,390 MQLs a year, or 116 a month.
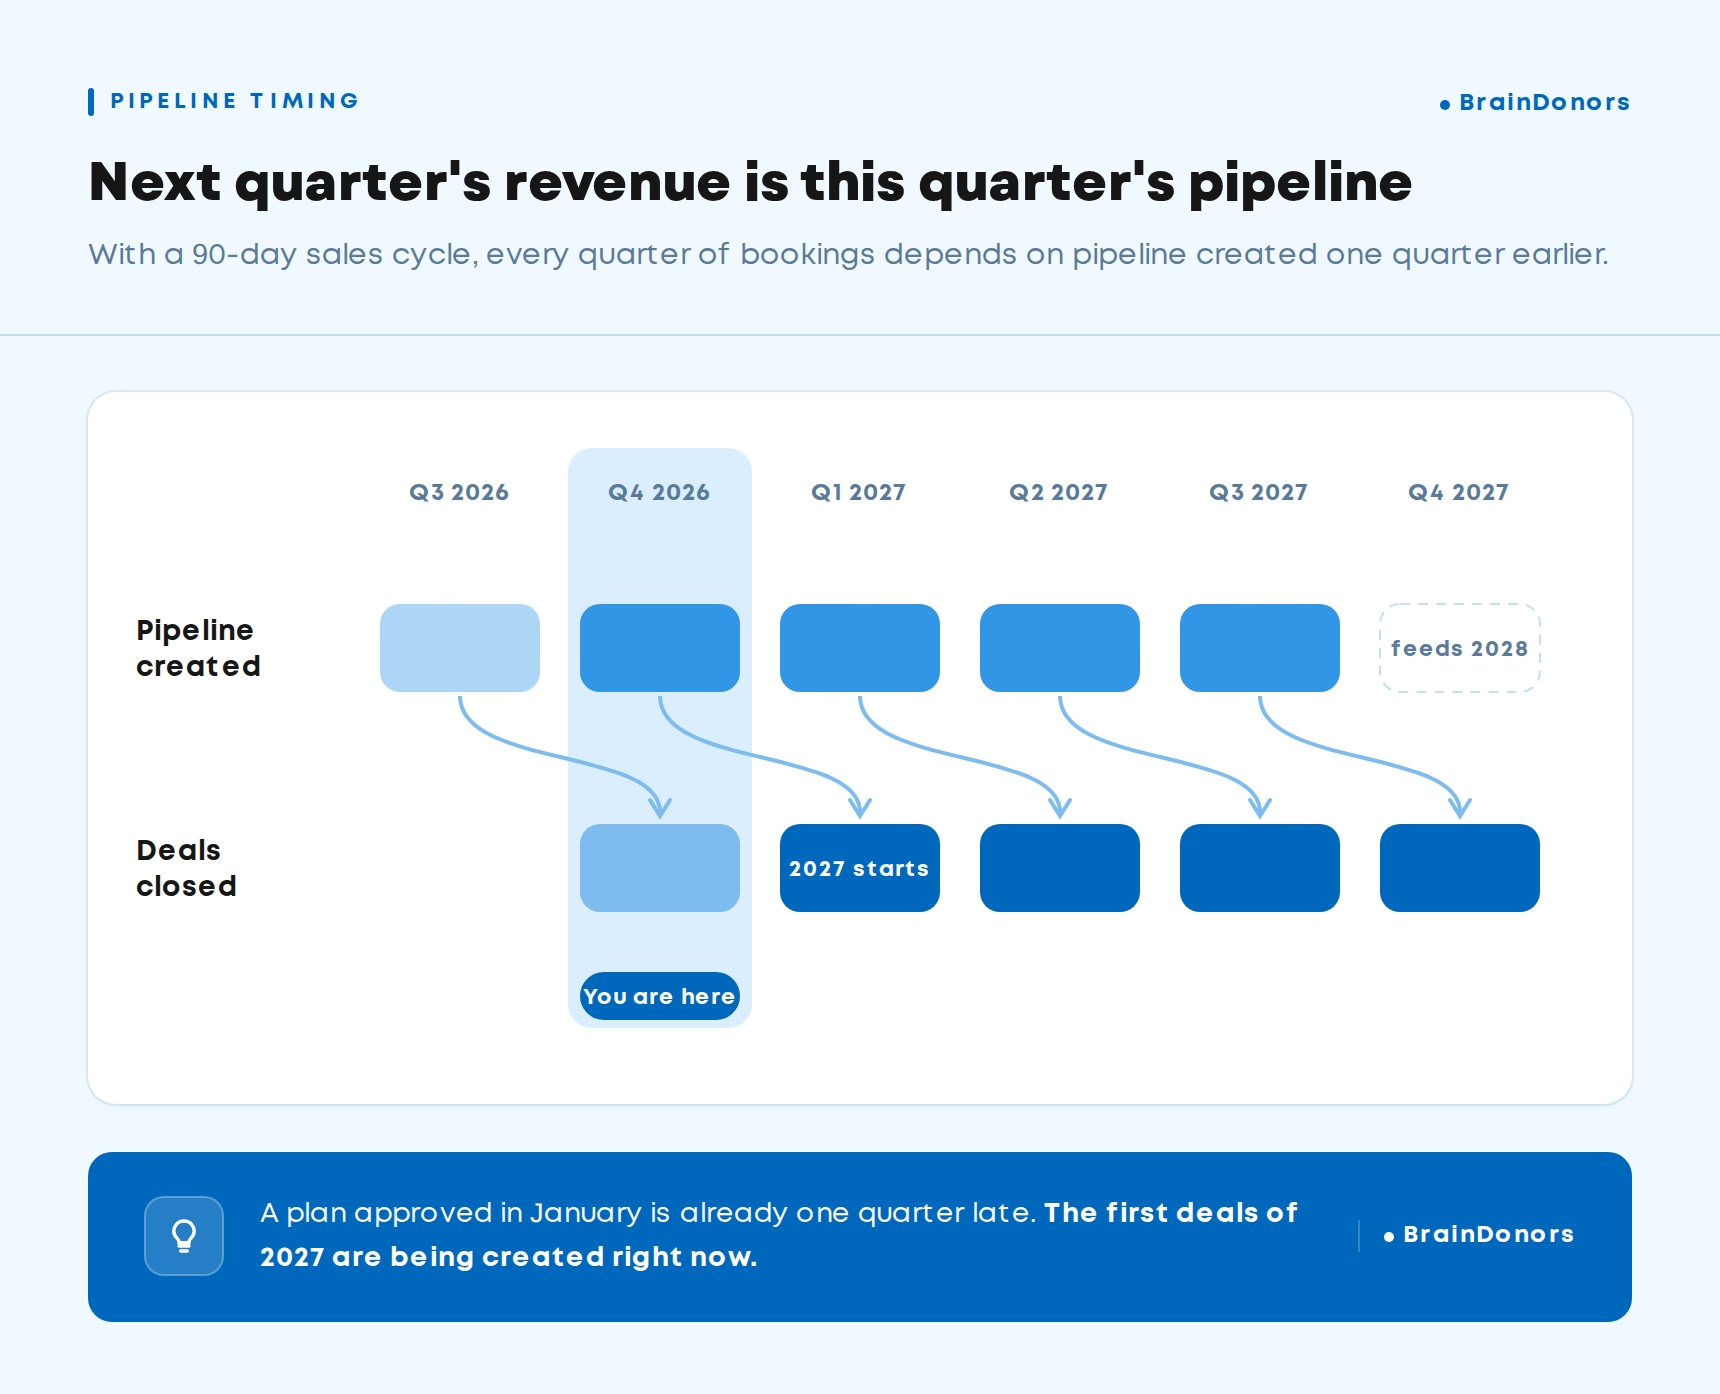
Pipeline has to exist before a deal can close. Shift each quarter's creation target back by your average sales cycle.
Example: With a 90-day cycle, deals that close in Q1 2027 must be created in Q4 2026. If Q4 is usually your biggest bookings quarter, Q3 has to be your heaviest pipeline creation quarter.
Copy this table into a spreadsheet, fill in the inputs from your CRM, and the formulas do the rest.

Then adjust for timing: with a six-month sales cycle, most of that pipeline needs to exist by mid-year, or it will close in 2028. Finally, multiply the opportunities by your cost per opportunity and compare it with your budget. If the two don’t match, change the target, not just the campaigns.
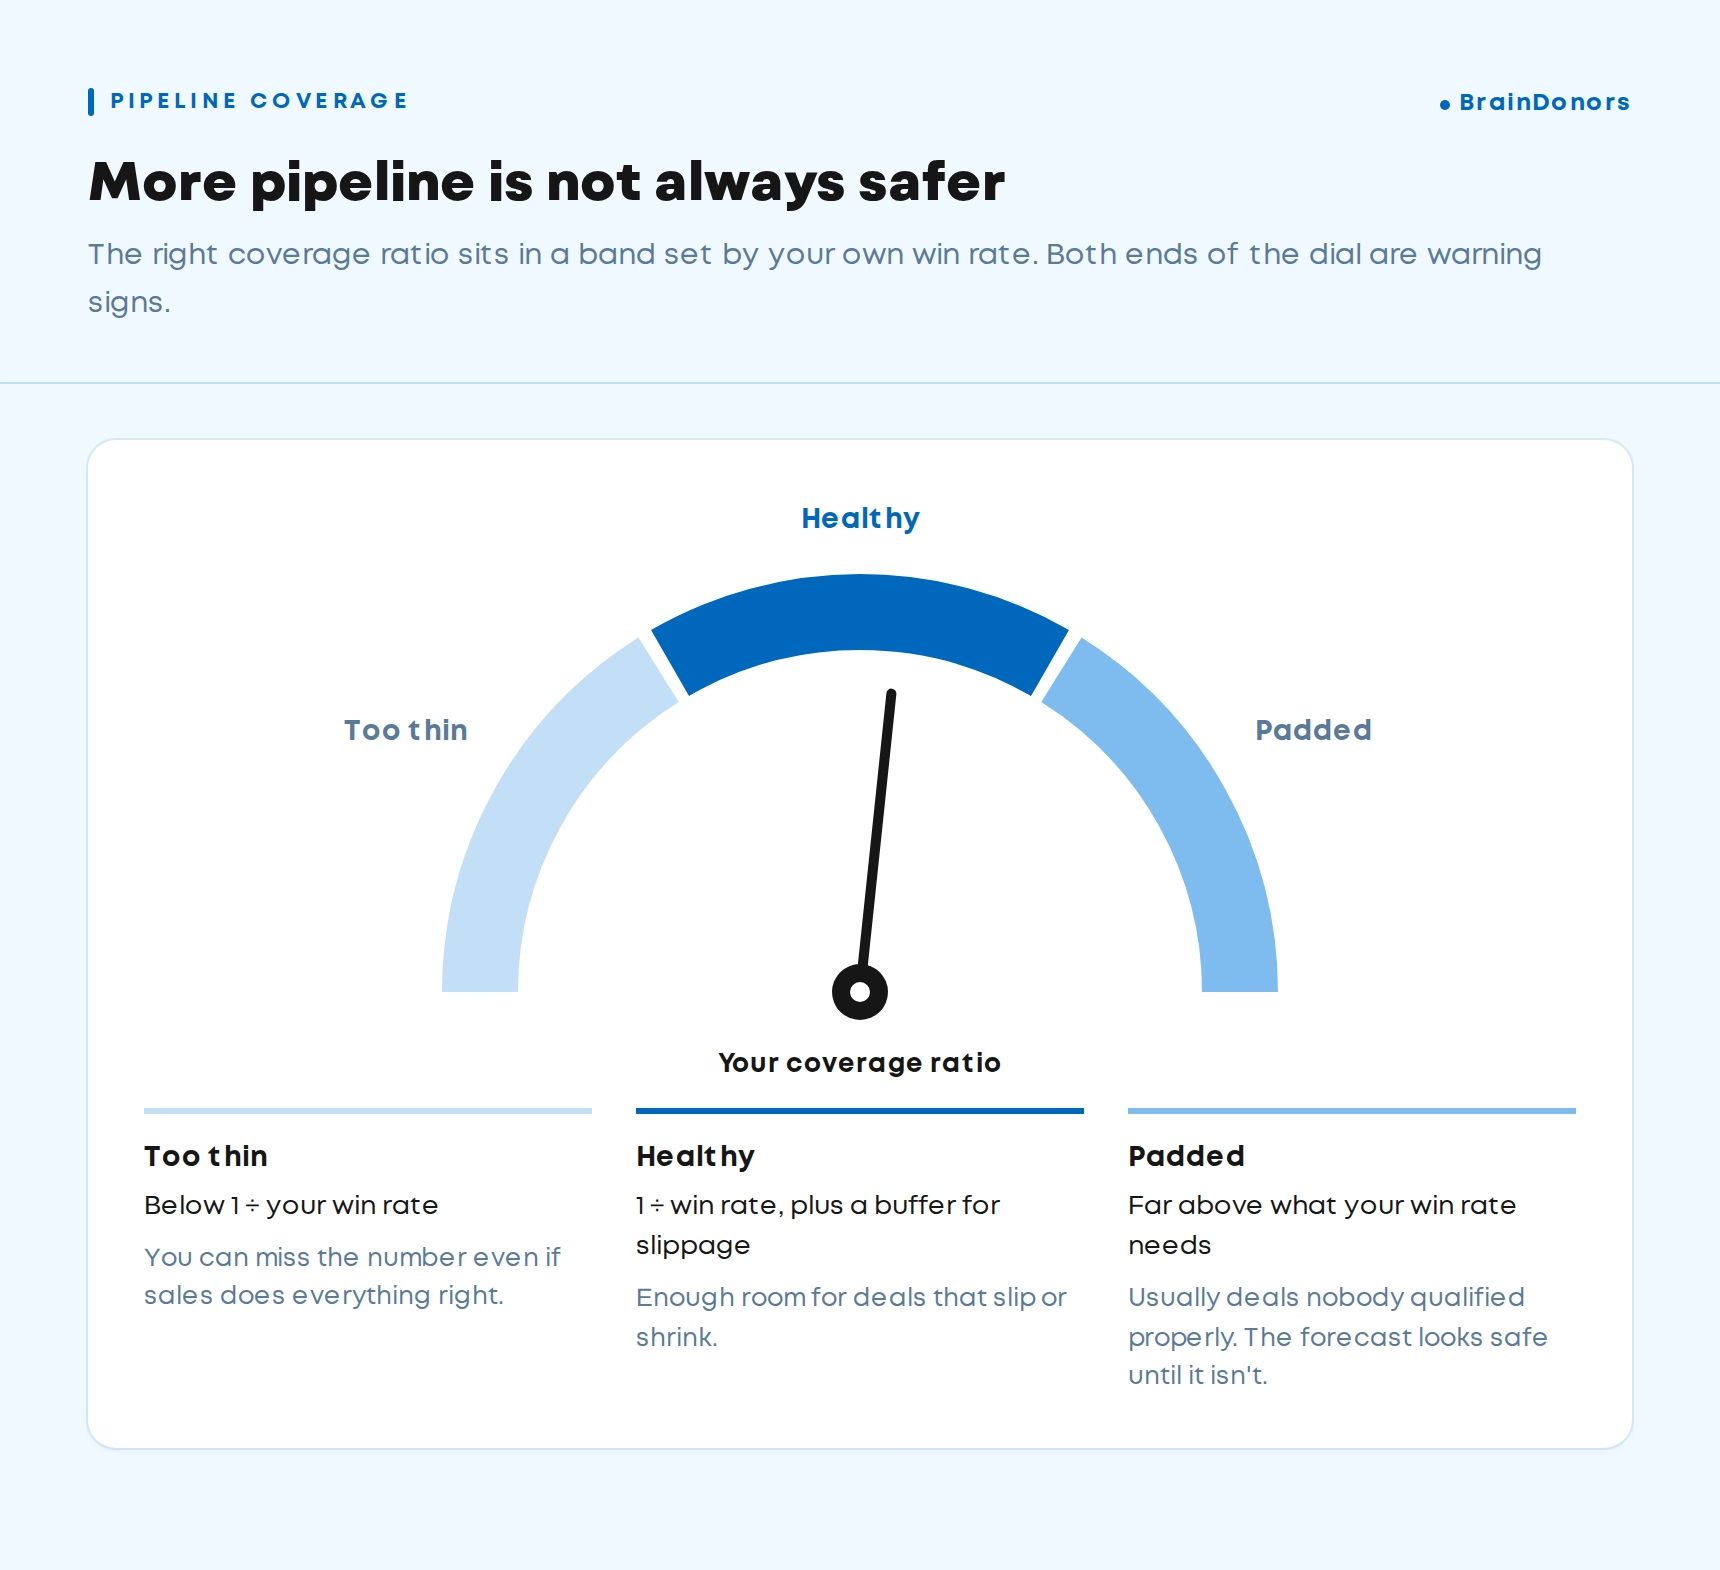
Pipeline coverage compares the value of open, qualified pipeline with the bookings target for the same period. If you need $1M in Q2 and have $4M in qualified pipeline, your coverage is 4x.
You've probably heard that 3x is healthy. That rule quietly assumes you win about one qualified deal in three. If your win rate is lower, 3x leaves you short every quarter.
A cleaner rule: required coverage = 1 ÷ win rate.
Then add a buffer for two things the formula ignores:
In our example, a 22% win rate means 4.5x minimum. With a typical 20% buffer, a target of around 5.5x is more realistic.
Timing matters too. Coverage measured on day one of the quarter tells you something useful. Coverage measured in week ten mostly tells you which deals you're about to lose.
Very high coverage is a warning sign as well. If you're sitting on 8x and still missing targets, the pipeline is probably padded with deals that were never properly qualified.
Marketing-sourced pipeline includes opportunities where marketing created the first meaningful contact, such as a demo request, an inbound inquiry or a webinar lead that turned into a deal.
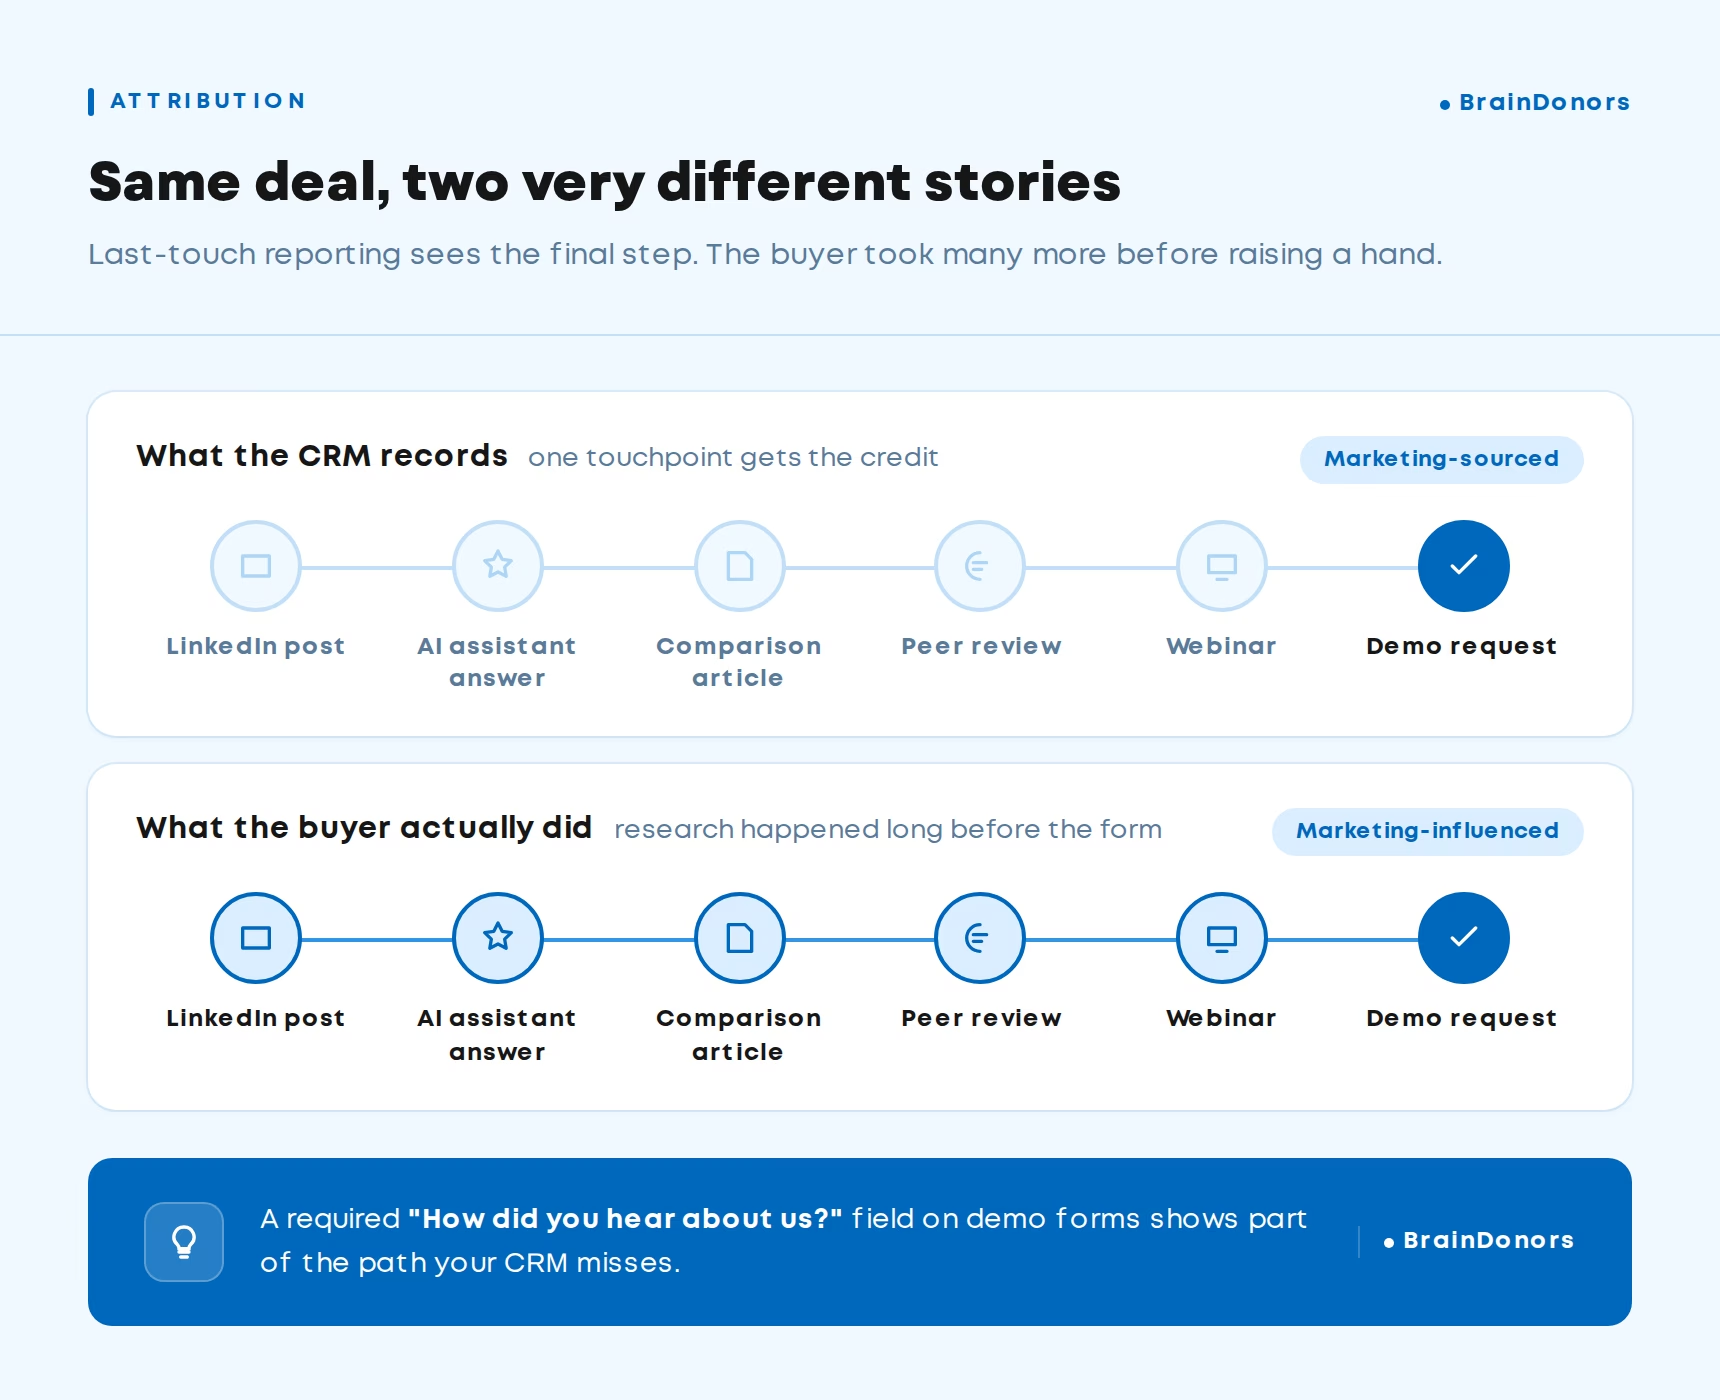
Marketing-influenced pipeline includes any opportunity where marketing touched at least one contact before or during the deal, no matter who sourced it.
Set marketing's target on sourced pipeline. Report influenced pipeline next to it, but never add the two together.
Influence is getting harder to see and more important to track. Gartner found that 67% of B2B buyers prefer a rep-free buying experience, and 45% used AI during a recent purchase.
A lot of the work that gets you shortlisted now happens in search results, AI answers and peer content, where last-touch attribution can't see it.
One fix we use with clients: add a required "How did you hear about us?" field to demo forms and compare the answers with your CRM source data. The gap is often surprising, especially for podcasts, LinkedIn and AI search visibility.
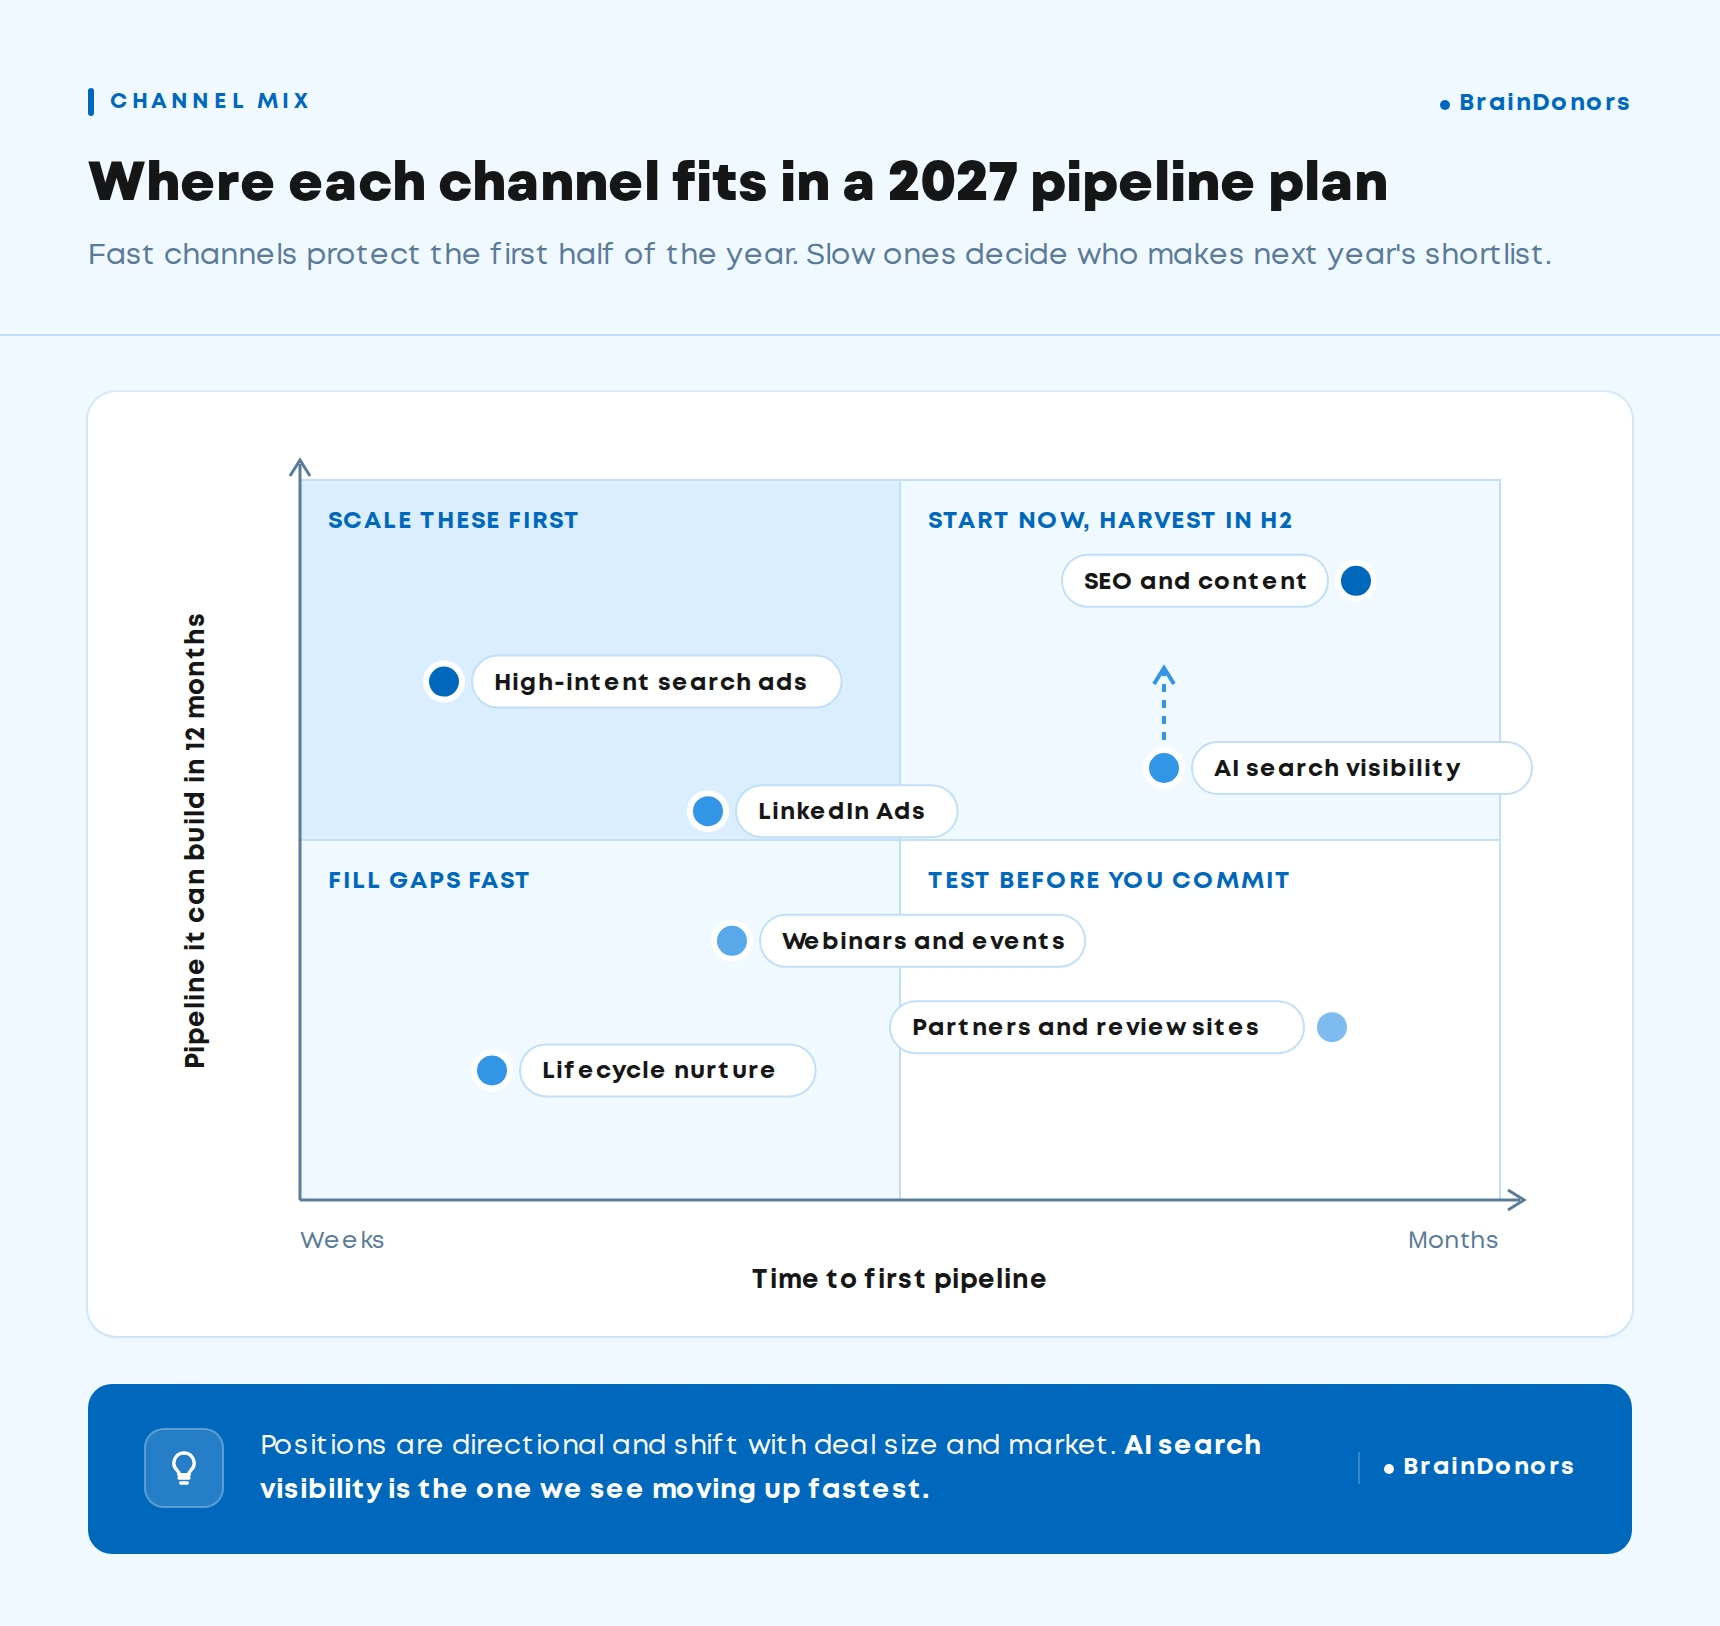
Each channel has its own speed and cost. A healthy pipeline generation plan mixes fast channels that capture existing demand with slower ones that put you on next year's shortlists.
The timings below reflect what we see across client accounts. Yours will move with deal size and market maturity.
For the fast end of the table, a focused Google Ads strategy and well-run B2B paid media usually carry the first two quarters. For the slower end, a B2B SEO strategy and a content marketing strategy built around buyer questions start paying off in the second half of the year.
A practical rule: plan Q1 and Q2 mostly on channels with a proven cost per opportunity. Use the second half to scale channels that are still ramping, so they're mature by the time 2028 planning starts. Our demand gen strategies playbook goes deeper on how to sequence them.
A pipeline number can be mathematically correct and still impossible. Run these three checks before it goes in front of the CEO or the board.
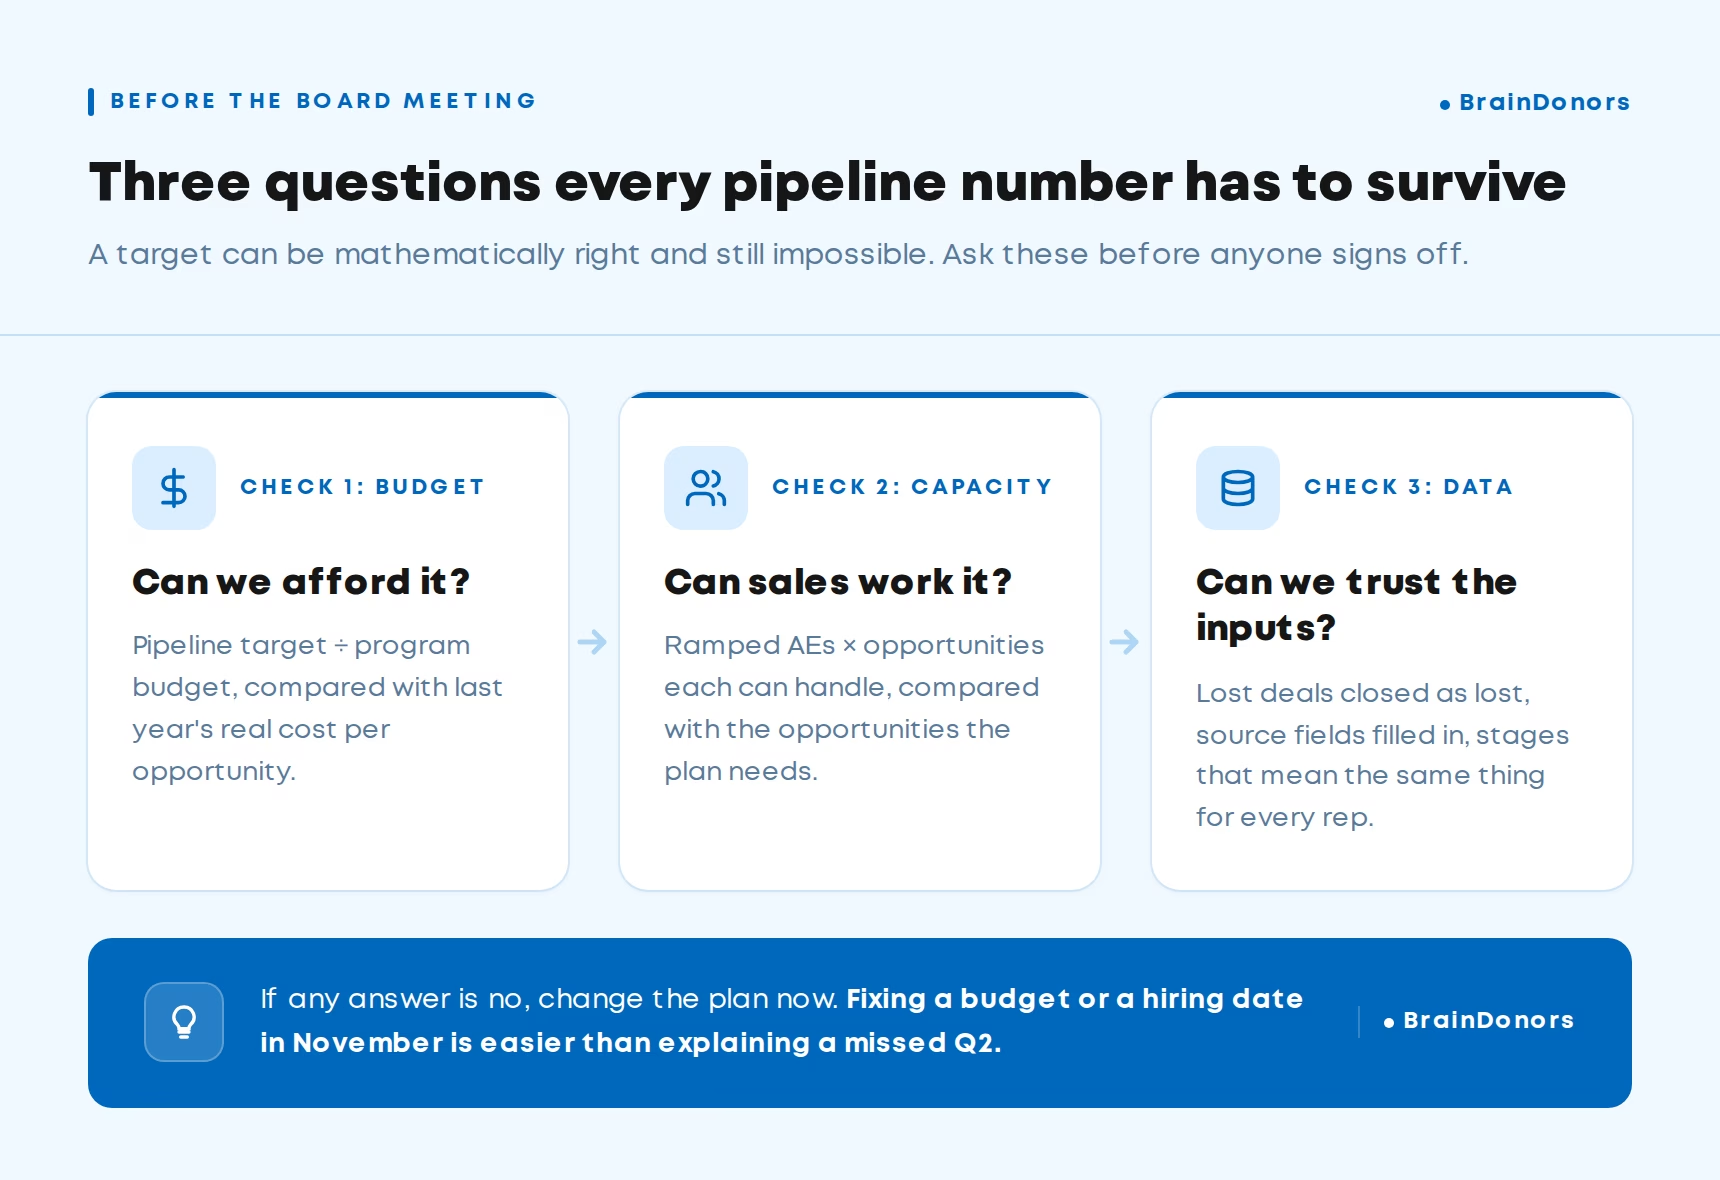
Divide marketing's pipeline target by your planned program budget. That tells you how much pipeline each dollar has to produce.
Example: $8.75M of marketing-sourced pipeline on a $1.2M program budget means about $7.30 of pipeline per dollar, or roughly $4,800 per opportunity. If you paid $9,000 per opportunity last year, the plan needs more budget or a believable reason costs will drop.
Budgets are tight across the market. Gartner's 2026 survey puts the average marketing budget at 7.8% of company revenue, and 56% of CMOs say they don't have enough budget to deliver their strategy. A plan that assumes a large efficiency jump without evidence rarely survives the CFO meeting.
More pipeline only helps if someone can work it. Multiply ramped account executives by the number of new opportunities each one can handle per month, then compare that with your target.
Example: Six ramped AEs who can each take on six new opportunities a month can work 432 a year. The plan needs 455. Either hiring moves earlier in the year, or the revenue target comes down.
Your plan is only as good as the CRM data behind it. Before you trust a win rate, check that lost deals actually get marked as lost, that source fields are filled in, and that each opportunity stage means the same thing for every rep.
We often see win rates that look better than they are because stale deals sit open for months instead of being closed out. A clean HubSpot setup with clear stage definitions fixes most of this before planning even starts.
Pipeline planning gets real when it meets a CRM, a sales team and a budget. Here are three ways it has played out with our clients.
Meavo, a B2B technology company selling across several countries, had separate tools for sales, marketing and service. Inquiries were misrouted or lost between regions, so part of the pipeline disappeared before anyone could work it.
We built one HubSpot environment with automated routing, standard qualification and shared pipelines across regions. The result was 100% lead capture and zero lost inbound inquiries. Any pipeline plan assumes every lead gets worked, so this is the first thing to fix.
The Journey runs two models under one brand: CEO consulting and an AI-powered SaaS assistant. Each needed its own funnel and buyer journey.
We set up separate pipelines in HubSpot, rebuilt the website, and connected SEO and LinkedIn Ads to both funnels. New requests grew 166%, booked meetings rose 80%, and cost per lead dropped 50%. That's exactly the kind of change that makes the budget check pass.
Imagen AI already had a strong product-led motion and wanted a sales-led channel for higher-value customers. A new source needs its own stages and reporting before it can carry a target.
We built the full lead-to-closed-won process inside their existing HubSpot, synced with their data warehouse, including handoff from a third-party outbound agency. The new channel hit 100% of its first-year targets, and the sales team grew to five people.
The best time to set next year's number is while you can still create the pipeline that closes in Q1. That means now.
Start with new-customer revenue, use your own win rate, split the target honestly by source, and run the budget, capacity and data checks before anyone signs off. The template above gets you most of the way in an afternoon.
If the math shows a gap, that's useful information. It's far easier to fix a budget, a hiring plan or a channel mix in November than to explain a missed quarter in April.
Ideally by early Q4 2026. Pipeline for deals that close in Q1 2027 has to be created during Q4, so a plan finished in January is already a quarter behind. Review it every quarter after that.
Lead generation counts people who raised their hand. Pipeline generation counts qualified opportunities with a dollar value that sales has accepted. Set targets on pipeline and use lead volume as an early signal.
Pipeline velocity shows how fast pipeline turns into revenue: (opportunities × win rate × average deal size) ÷ sales cycle length in days. Coverage tells you if you have enough pipeline, and velocity tells you how quickly it pays off.
Use both. Dollars connect the target to revenue, while opportunity counts stop one oversized deal from hiding a weak quarter. If deal size varies a lot by segment, set separate targets for each.
Track it monthly and reset assumptions every quarter. If your win rate, deal size or sales cycle moves more than about 10% from plan, rerun the reverse-funnel math instead of waiting for year-end.